
I'm definitely overdue as far as posting an update on the progress of the work we've been doing to improve EXA performance for the i965 driver. And just yesterday, Benjamin Otte pointed out to me that it's really hard for many people to get any understanding at all about some of the work that's going on within the X.org development community.
Part of my reply to Benjamin was that there were a lot of excellent talks given at LCA this year, (Keith Packard, Dave Airlie, Adam Jackson, Jesse Barnes, Peter Hutterer, Eric Anholt, and myself were all there talking about X in one way or another). And that is true, but it's also true that many people were not able to attend LCA to hear those talks. And while the LCA conference kindly posts video of the talks that's not always the most desirable way of getting information when not at the conference in person.
So I think it would be fair to say that we've been doing a poor job of providing easy-to-find information about what's going on with X. I definitely want to help improve that, and I even just got an official designation to do exactly that. I was recently elected to the X.org Board of Directors and also assigned to chair a Communications committee whose job it is to help X.org communicate more effectively. What can we do better? Please email me with your ideas.
In the meantime, for my own part, I've just done a fairly thorough writeup of my LCA talk. That's something I've been wanting to get in the habit of doing for a while. One thing I can't stand is reading presentation slides that are almost content free---where clearly they weren't meant to stand alone but were meant to be accompanied by someone speaking for up to an hour. And I know I've been guilty of posting slides like that before. So this time, I've written some text that should stand alone quite well, (though, since I just wrote it today it might not correlate extremely well with what I said that day at LCA---but I've tried to address the same themes at least).
Posted Wed 12 Mar 2008 09:33:26 AM PDTAs readers of my blog know, I've been working on improving the Intel 965 driver within the EXA acceleration architecture of the X server. Meanwhile, there's an alternate acceleration architecture originally announced by Zack Rusin in August 2006 called Glucose. The idea with Glucose is to accelerate X rendering operations by using OpenGL.
Recently there's been a fair amount of activity in the various Glucose branches, so I thought I'd take a look to see how well it's working. This was quite convenient for me as the current Glucose work is focused only on Intel cards. Since Glucose isn't quite ready for prime-time yet, it does require fetching various non-master branches of several git repositories. It's not always obvious which branches to take, so José Fonseca was kind enough to writeup some Glucose build instructions.
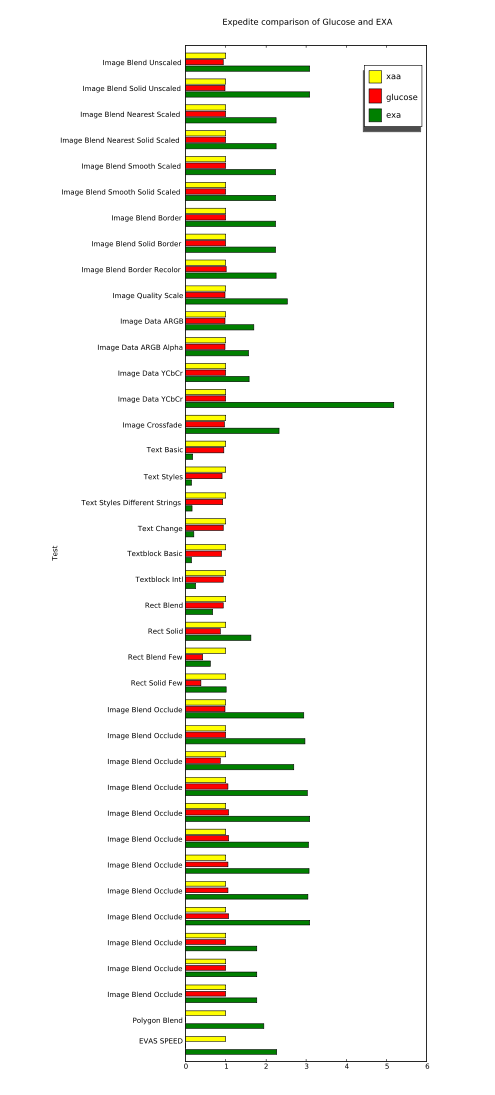
I've followed those instructions and run a benchmark comparing Glucose and EXA. The benchmark I chose is the expedite application that comes with evas, (thanks to the people that kindly pointed out this newer benchmark to me after my recent explorations with the older evas benchmarks). To get expedite you'll need the e17/libs/evas and e17/apps/expedite modules from enlightenment CVS.
Expedite is a nice benchmark in that it separates things like image blending and text rendering into separate tests, (unlike the older evas benchmark). It's also nice that evas includes many backends which can be interesting for comparison. But I won't be looking at anything but its XRender-based backends here---and it looks like evas' cairo and OpenGL backends are not currently functional. They are disabled by default, and when I enabled them I ran into compilation problems, (I suspect neglect and bit rot).
So here are the results I got for three acceleration architectures:
XAA with the XAANoOffscreenPixmaps option, (this is an all-software implementation for reference).
Glucose---the new thing we're looking at here.
EXA, (as available in the various glucose branches---so without things like my recent glyph-pixmaps work).
The results are all normalized to the performance of our baseline, XAA. And larger numbers are better.
The raw data is also available for anyone with particular interest, (it has non-normalized values as well as results from evas' software backends using both SDL and X11 for image transport).
The quick conclusion is that, so far, I'm not getting any benefit from running Glucose as compared to just running an all-software implementation, (see how all Glucose and XAA bars are basically identical). I might still not have everything compiled or running correctly yet, but I'm quite sure that at least some Glucose code was active during my Glucose run. That's because a glucose module failed to find a required symbol and crashed during the "Polygon Blend" test, (which is why it doesn't have a bar in the chart, nor is there a number for the overall "EVAS SPEED" result for Glucose).
Meanwhile, it's also clear that EXA is going far too slow for text operations. This isn't any surprise since I've documented problems with slow text rendering on the i965 several times before. However, I've never before measured text rendering that's quite this slow. I'm seeing speeds of only about 30k glyphs/sec. with EXA on these branches, while my previous testing always showed about 100k glyphs/sec. I suspect that there's been some regression somewhere in the X server or the Intel driver, (and likely unrelated to anything about Glucose---Keith has reported similar slowness with builds from the master branches).
Another interesting thing to look at is the difference caused by the "few" variants of the "Rect Blend" and "Rect Solid" tests. When going from the non-few to the "few" variants, both Glucose and EXA slow down significantly. I'm quite happy to see these tests in this benchmark since it is often the setup overhead that kills you when trying to accelerate a small number of operations, (and applications have a tendency to want to do that very often). Many synthetic benchmarks are extremely non-useful in hiding this overhead by doing huge batches of operations.
Meanwhile, I'm still working on fixing the horribly slow compositing problems in the i965 driver that are keeping text so slow. Keith Packard and Eric Anholt are helping me debug my code, and hopefully we'll soon have something to show which runs at a reasonable speed.
Posted Fri 19 Oct 2007 02:47:53 PM PDTEarlier this month I attended the X Developers' Summit in Cambridge, UK (not the Cambridge near Boston, USA). We stayed at Clare College which, like all of the University of Cambridge colleges that I saw, is immaculately well-kept and quite beautiful. Just look at the gardens I walked past every day to get from my room to the conference room in the library. Kudos to the X.Org foundation for arranging such a beautiful site, (I think Daniel Stone and Matthew Garrett deserve particular thanks), and for providing travel expenses so I could attend.
Adam "ajax" Jackson was kind enough to write up some notes on my talk and the other talks as well. I haven't posted slides from the talk, but it really wasn't much more than a condensed version of exa-related blog entries I've made, (and which are linked to in Adam's writeup).
One of the things I asked for in the talk is more benchmarks for 2D rendering---in particular real-world applications with benchmarking modes and micro-benchmarks distilled from real-world applications. Vincent Torri recently reminded me that Carsten "rasterman" Haitzler wrote render_bench a long time ago precisely to measure the performance of XRender, (and to compare it to his imlib2 software).
I hadn't run render_bench since I started playing with EXA and the
i965 chip, so it was definitely a worthwhile thing to do. Here are the
results I got (comparing XAA and EXA both against imlib2):
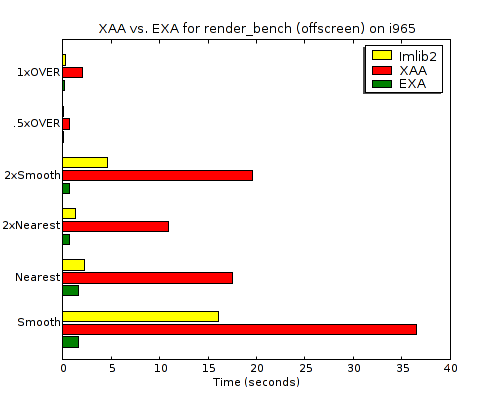
All of the numbers are from the same 2.13GHz dual-core Intel machine. But the absolute numbers aren't interesting anyway. The interesting part is the huge improvement in X Render performance going from XAA to EXA for the i965 device. It goes from 2-8 times slower than imlib2 to 1.3-12.9 times faster. Anyone interested in the raw times can view the EXA log and XAA log files.
One thing that would be useful is for someone to augment the framework to also test the same drawing operations through cairo. It would be good to verify that none of the cairo software layers get in the way of this performance, (I can imagine cairo doing something like setting up and tearing down XRender Picture objects rather than reusing them, but hopefully it will perform just as well).
And I should point out that this improvement is not due to anything I've done. This is basically just an upstream xserver tree, (it might have my glyph-pixmaps change but they are not relevant here). So kudos to the EXA hackers I mentioned in my talk, (Keith Packard, Zack Rusin, Eric Anholt, and Michel Dänzer). I definitely need to amend my what EXA gets right post to add image-scaling to window-copying and solid-fills.
This also isn't with any special hacks to the xf86-driver-intel source, (I'm using upstream commit 286f5df0b from Sep. 6). This benchmark clearly isn't hitting the same compositing slowness I'm seeing with glyph rendering and that might be because it's using larger images than the generally tiny images that are used for glyphs, (but I'm just guessing---I haven't looked closely).
Meanwhile, I am rewriting the driver to eliminate all the syncs and flushes when compositing to fix the glyph performance. I hope to have something worth sharing soon.
Finally, I also compared the results of evas_xrender_x11_test with
evas_software_x11_test. This is similar to the original render_bench,
but with a more real-world framework in place, (the evas canvas), as
opposed to just a micro benchmark. Here XRender/EXA did not fare as
well, scoring an evas benchmark score of 4.994 compared to the 10.418
of the software version. (Meanwhile XAA scored 4.840 but with some
noticeably incorrect results---the large scaled image came out just
black). The weaker performance here might very well be because the
evas tests do include text which render_bench does not, (but again I'm
just guessing and haven't looked closely).
Oh, and the evas snapshot I used for this test is
evas-0.9.9.023. I
tried to also test a newer snapshot such as
evas-0.9.9.041,
but it seems to not build the evas_*_test programs anymore. Perhaps
they're now available separately?
Sometimes things get worse before they get better.
A few days ago, I presented a patch for storing glyphs as pixmaps which improved performance, but not as dramatically as one would have hoped.
I profiled the result and found that there were still a lot of software fallbacks going on. Tracking things down, (hints: enable DEBUG_TRACE_FALL in xserver/exa/exa_priv.h and I830DEBUG in xf86-video-intel/src/i830.h), I found a simple case statement that was falling back to software for any compositing operation targeting an A8 buffer. Fortunately, it looks like this fallback was due to a limitation in older graphics card that doesn't exist on the i965. So a very simple patch eliminates the software fallback.
So lets take a look at before-and-after profiles:
Yikes! The patch takes us from 144k chars/sec. to only 95k chars/sec. I'm regressing performance! But look again, and see that the libexa time has been cut dramatically, and the libpixman time has been eliminated altogether. That's exactly what we would hope to see for eliminating software fallbacks. So I've finally gotten this text-rendering benchmark to involve no software fallbacks. Hurrah!
Meanwhile, the intel_drv and vmlinux time have increased dramatically. Take a look at how hot those hotspots are in their profiles:
intel_drv:
samples  %        symbol name
29614    41.2170  i965_prepare_composite
26641    37.0792  I830WaitLpRing
9143     12.7253  i965_composite
1618      2.2519  I830Sync
vmlinux:
samples  %        symbol name
28775    25.3748  delay_tsc
21956    19.3616  system_call
7535      6.6446  getnstimeofday
5109      4.5053  schedule
So this is just the same, old synchronous compositing bug I identified earlier. Performance has gotten worse since I'm stressing out the driver and this bug more.
Dave Airlie has been doing some recent work that should let us fix that bug once and for all. Hopefully it won't be too long before I can actually post some positive progress here.
PS. I've also gotten one report that my patch for storing glyphs as Pixmaps speeds glyph rendering up initially, but after the X server has been running for about an hour or so, things get really slow. Shame on me for not doing any testing more extensive than starting the X server and then running a single client for a few minutes, (either firefox or x11perf). The report is that most of the time is disappearing into ExaOffscreenMarkUsed. Well the good news is that Dave's work eliminates that function entirely, (along with lots of migration code in EXA), so hopefully there's not any big problem to fix there. I'll have to test more thoroughly after synching up with Dave.
Posted Tue 07 Aug 2007 06:13:22 PM PDTA few months ago I reached the conclusion that remaining cairo performance problems were largely not in the cairo library itself, but were in the X server, its acceleration architectures, or in the X drivers for specific devices. So I started measuring with the cairo-perf suite of micro-benchmarks and I identified what appeared to be some potential problems. For example, there are OVER operations that should degenerate into simple blits but that seem to be running 2x slower than blits, (more on this later).
Before pursuing those in detail, (or after chasing a non-problem for too long), I decided to step back from micro benchmarks and instead look at some real-world tests with the Mozilla Trender suite to ensure I wasn't doing micro-optimization that wouldn't have any significant impact. It was at that time that I also switched my focus from an ATI r100, (which was just the graphics chip that happened to be in my laptop), to looking at the Intel 965 chip instead, (since Intel had donated one for me to work with).
The i965 is interesting because it's new, (ooh, shiny!), and coming from a company that actually supports the free software community by providing free software drivers. That support continues to improve as last week, Intel made technical documentation on the i965 available to myself and other Red Hat employees. (The documentation was made available under an existing Intel-Red Hat NDA which means I cannot share the documentation, but I can use the documentation to write, improve, and release free-software drivers.) I'm optimistic that Intel will be willing to setup a similar NDA with anyone interested in improving the drivers, and even better, that Intel will eventually convince itself it can share the documentation as freely as it is currently sharing its driver source code.
And actually, the work I've done in the last week hasn't strictly required the documentation at all. What has been necessary is to roll up my sleeves and get more familiar with the X server source code. I'm really grateful to Keith Packard, Eric Anholt, Dave Airlie, Kevin Martin, Michel Dänzer, Adam Jackson, Daniel Stone and others who have helped me get started here. There's really a very welcoming community of very intelligent people around the X server who are glad to help guide new people who want to help. And there's no shortage of things that can be done.
It is a large code base to get familiar with, (using "git grep" to find things helps a lot). And, being as old as it is, it does have lots of "moldy" aspects to the way it's coded, but it's not as bad as one might fear. So please, come join us if you're interested!
Guided by the problems showcased by the Mozilla test suite and the i965 driver, I decided that the most obviously underperforming operation is glyph compositing. And I also identified two underlying problems: excessive migration and synchronous compositing.
With the problems identified that concretely, I'm actually working on fixing problems now instead of just reporting them. And for this focused work, it makes sense to get back to micro-benchmarks for tracking the specific things I'm working on. So I started out with "x11perf -aa10text" to test glyph compositing performance. A more general operation than glyph compositing is image compositing, but it seems that x11perf has never acquired any Render-based image compositing benchmarks, (maybe that explains why some compositing performance regressions went unnoticed?). I did convince Keith to sit down and write some x11perf-based compositing tests, which I expect he'll push out shortly. And those tests should do a great job of highlighting the problems I seemed to see with cairo-perf where compositing with Over wasn't properly degenerating to blit performance when there is no source alpha.
In exchange, Keith convinced me to do some work to change the way glyph images are stored in the X server. Previously, glyph images have been chunks of system memory, which means they were off-limits for being used as part of any accelerated rendering. What EXA would do, is every time a glyph was to be rendered, it would first copy it into a video-memory Pixmap so that it could have some hope of accelerating it. So the same glyph data would get copied from system memory to video memory over and over again, (and likely overwhelm any performance advantage from doing "accelerated" compositing with the glyphs).
A fairly obvious solution is to move the canonical location for glyph data to be video-memory Pixmaps in the first place. This has a few potential problems:
Glyph images are sharable across the entire server, but Pixmaps are specific to each individual "screen" within the server.
The X server uses the system-memory glyph data to compare when a glyph is uploaded by a client that is identical to a glyph uploaded previously by another client, (using a simple XOR-based hash to do fewer comparisons---but always falling back to a full compare after matching the hash).
Recent work that Dave Airlie, Kristian Høgsberg, and Eric Anholt have been doing may result in there being a one-to-one relationship between Pixmaps and "buffer objects". And these buffer objects require page-alignment, so their minimal size will be 4k, (which could be quite excessive for small, 10x10 glyph).
Another concern before any of those is whether glyphs are even worth trying to accelerate in the first place. If they are small enough, might the overhead of involving the GPU be excessive and it would be better to simply let the CPU render them, (even if that requires some read-modify-write for the compositing)? For this concern, see the window-to-window copy results I just posted in what exa gets right. That shows that EXA (GPU based) copying can be 5x faster that NoAccel (CPU based) even with regions as small as 10x10. Add compositing to that, and the GPU should be just as fast, but the CPU should be slower. So we really should be able to win, even with fairly tiny glyphs.
So, how to tackle the other technical problems. Here's what I've come up with so far:
Per-screen Pixmaps: Suck it up for now. One, actually having multiple "screens" in the X server isn't common. Things like Xinerama that use one "screen" for multiple displays are much more common. So, I've written code that allocates one Pixmap per screen for every glyph. If this turns out to be a problem in practice, it would be quite trivial to create the Pixmaps lazily for all but one screen. And it would also be worthwhile, (but a much larger change), to lift the per-screen restriction for objects like Pixmaps.
System-memory data for avoiding hash collisions: The goal is to move the storage from system memory to a video-memory Pixmap. We lose, (by spending excess memory), if we still have to keep a system-memory image. To fix this, I've replaced the weak XOR-based hash with a cryptographically strong hash (SHA1) that will be (probabilistically) collision free. This does introduce a new dependency of the X server on the openssl library.
4k alignment constraints for buffer objects: This is likely a very real issue, but something I'd like to address later. Presumably we can alleviate the problem by pooling multiple glyphs within a single Pixmap, (or multiple Pixmaps within a single buffer object), or whatever necessary.
So, given those approaches, I've written a series of 7 patches implementing glyph storage as pixmaps.
On my i965 the patch series doesn't impact NoAccel or XAA performance considerably, but does improve EXA performance a bit. Here are the results for x11perf -aa10text and -aa24text:
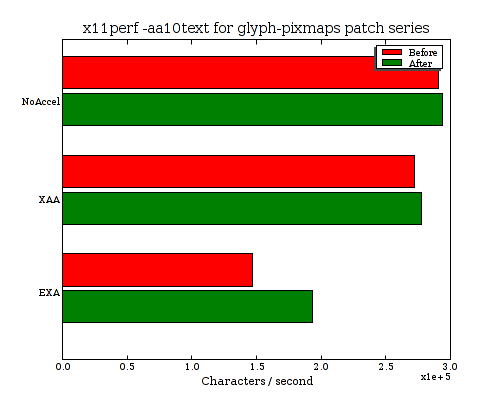
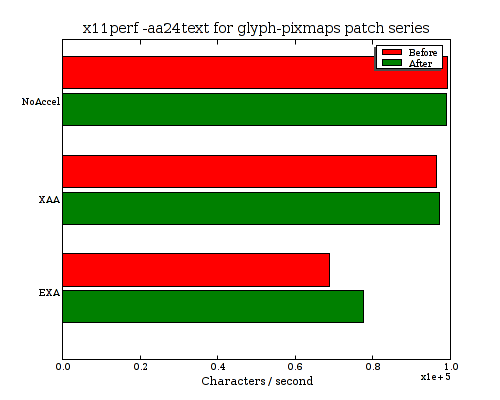
Now, that was quite a bit of work, (and way too long of a blog post already), but not yet any huge performance improvement. But I think this is a good, and necessary step toward getting to fast compositing of glyphs. Here are before-and-after performance charts for the aa10text test with links to profiles:
We can see that some copying was eliminated, (note the fbBlt contribution to libfb in the before profile has disappeared completely). But there's still some migration going on somewhere, (see the exaMemCpyBox stuff as well as a bunch of software rendering happening in pixman). The assumption I'm operating on is that we should be able to eliminate migration and software rendering entirely. The hardware is very capable, very flexible and programmable, and we have all the programming documentation. So there should just be a little work here to see what's still falling back to software and eliminating it.
Then, obviously, there's still the synchronous compositing problem. I'm guessing that's where the big time spent in the kernel is coming from. So imagine half of the pixman and kernel chunks going away, along with 25% of the libexa chunk and over half of libc, (that looks like the obvious hotspots from excessive migration synchronous compositing). And then EXA text would at least catch up to XAA and NoAccel.
But if we only match the performance, we're wasting our time and should just use the NoAccel code paths in the first place. But I'm optimistic that there's still quite a bit of optimization that could happen after that. We'll see of course.
Posted Fri 03 Aug 2007 05:45:38 PM PDTI've been writing various posts about EXA for a couple of months now. And for the most part, they've been fairly negative, (showing big slowdowns compared to running an X server without acceleration at all, for example).
As I've talked to people that have read the posts, it's clear that I've managed to spread some misconceptions. So let me clear things up now:
Running your server with NoAccel is not a good idea
EXA does accelerate a lot of things already
EXA is not doomed, nor were its authors idiots to have written it
The reason my posts have focused on negative performance aspects is because I was looking for things that could be sped up, and as is only appropriate I looked for, found, and have been focused on the biggest performance problem with EXA I could find, (which turns out to be glyph rendering).
So, briefly here, I want to mention a couple of things that EXA is doing a fine job with. The first is the big reason why you don't want to run an X server with NoAccel: scrolling will hurt very badly. Take a look at these rates for a window-to-window copy of a rectangle of various sizes. These results are from "x11perf -copywinwinX" and multiplied by the number of pixels in each operation.
[All tests here are with very recent checkouts of xserver, mesa, and xf86-video-intel. Tests are run on an Intel Core 2 CPU @ 2.13GHz with an Intel 965 graphics card. Thanks, Intel for the donation of hardware for this testing!]
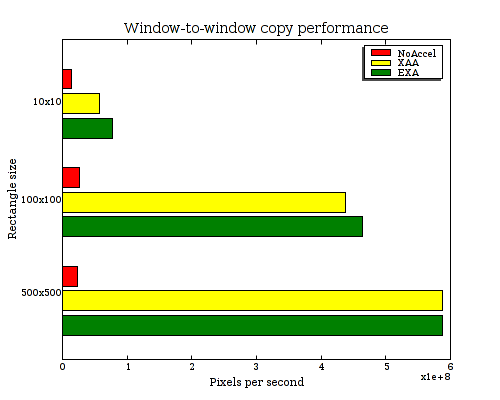
| Window-to-window copy performance (Millions of pixels/sec.) | |||
|---|---|---|---|
| Rectangle size | 10x10 | 100x100 | 500x500 |
| NoAccel | 14.2 | 26.5 | 23.475 |
| XAA | 57.8 | 438 | 587.5 |
| EXA | 77.6 | 464 | 587.5 |
So here we can see that EXA is from 5 to 25 times faster for scrolling windows, depending on the size. And I can assure you that you definitely don't want windows to start scrolling 25 times slower (chug, chug, chug). Meanwhile, EXA is marginally faster than XAA on this test, but not significantly.
Second, let's look at another common operation, filling solid rectangles. This is an essential step in almost any rending, (for clearing to the background color), as well as for actually rendering some content. These results are from "x11perf -rectX", again multiplied by the number of pixels in each operation.
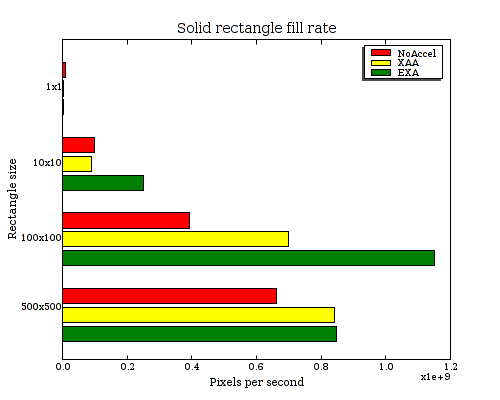
| Solid rectangle fill rate (Millions of pixels/sec.) | ||||
|---|---|---|---|---|
| Rectangle size | 1x1 | 10x10 | 100x100 | 500x500 |
| NoAccel | 10.5 | 99.6 | 392 | 662.5 |
| XAA | 1.5 | 90.9 | 698 | 842.5 |
| EXA | 2.5 | 250 | 1150 | 847.5 |
Again, EXA outperforms NoAccel here (from 1.3x to 2.9x faster), for all but the tiniest of rectangles. Interestingly, EXA also outperforms XAA by up to 2.7x for the 10x10 rectangle. Also, it's quite interesting to note, (and it's hard to see on the bar chart), that NoAccel outperforms EXA (4.2x) and XAA (7x) for the case of a 1x1 rectangle. Presumably the overhead of setting up hardware rendering for a single-pixel object just plain isn't worth it, (which really shouldn't be that surprising).
So those are a couple of the operations where EXA and XAA are already performing quite well. Some of you will note that Keith Packard has often joked that an X server doesn't need more acceleration than these two operations to perform well. And if you look at the whole set of operations in the XAA interface, indeed you'll find many there that modern applications won't use at all.
But meanwhile, applications are now using the Render extension more and more extensively to draw things. And this is where EXA should afford some acceleration possibilities that XAA does not. And this is also where I've been identifying several problems. If "copy" and "solid fill" are the two most fundamental operations, maybe the next two are "compositing" and "compositing glyphs". I've been talking about problems in those operations for a while, and I plan to start talking about actual solutions soon.
Stay tuned.
Posted Fri 03 Aug 2007 03:59:55 PM PDTEarlier this week I isolated some bugs that are currently causing a 4x slowdown with EXA and the i965 driver compared to using the NoAccel option of the X server.
Some people have wondered if the discouraging results I have found so far suggest that we should give up on hardware acceleration or that EXA as an acceleration architecture is doomed. I think the answer is no on both points. I think we're just seeing typical behavior of new code that needs some optimization.
EXA without acceleration
The first experiment is a very simple one to ensure that the 4x slowdown isn't an unavoidable aspect of having EXA enabled. In this experiment I first disabled the accelerated-compositing functions in the i965 driver, then I disabled EXA migration. The net result of this experiment is that the X server will still go through the EXA paths, but will basically use all the same software-fallbacks for compositing that are used in the case of NoAccel. The performance with this patch can be compared to the NoAccel case here. (Again, click through to my blog if you're just getting a list of numbers, not a colorful bar chart.)
It's worth pointing out that with this change, everything still renders correctly. Basically, we're using the same rendering code as in the NoAccel case, but we're using EXA to get there. And we can see that there is some overhead to EXA seen here, (a 10% slowdown), but nothing like the 400% slowdown seen before. There's certainly no indication here that EXA is doomed to be horribly slow, for example.
Now, this experiment does miss overhead in EXA having to do with managing video memory, (since I disabled all migration so everything lives in system memory). We'll be able to see this additional overhead below.
Emulating future i965 speedups
The above experiment is still pretty boring---it's still just measuring software-fallback performance. A much more interesting experiment allows us to start exploring where will be able to get with some un-broken hardware acceleration.
My previous post highlighted two significant problems preventing the current code from having good performance:
Time lost migrating pixmaps with memcpy
Time wasted while the driver busy-waited between operations
Here's a run-down of what I could find about progress on solving these two problems:
Excessive migration
When I looked closer at what was causing the pixmap migration, I found that much of it was due to glyph images being pinned to system memory, (recall that the benchmark I'm using is Mozilla Firefox on a page consisting of mostly text). I asked Keith Packard about why these glyph images are being pinned to system memory, and he explained that what was preventing the glyphs from migrating is that the X server has not been using straight Pixmaps for glyphs, but something slightly different.
Keith is already mostly finished with a change to make the server use Pixmaps for glyphs. Apparently there is one slight snag in that Pixmaps are a per-screen resource while glyphs are not. For now, that could be worked around by using one Pixmap per screen, (until Pixmaps and other resources can be made global within the server).
So, hopefully that glyph pinning problem will be fixed. Meanwhile, it's fairly silly that there's a bunch of memcpy operations to migrate things from "system" to "video" memory on the i965 anyway. This card doesn't have dedicated video memory, but just uses system memory anyway, (all that's needed is for some entries to be set in the GART table, and for some alignment constraints to be satisfied). So it should be possible to eliminate all of this memcpy time anyway.
I'm told that the long-awaited memory management work, (TTM), is what will solve this. I don't know what the status of that work is, but hopefully it will be ready soon. does anyone have some pointers for more information on TTM status?
Synchronous compositing
I characterized this problem fairly well in my previous post. Eric Anholt suggested a first quick step toward improving the situation would be to use an array of state buffers. With N buffers we could make the waiting happen only 1/N as frequently as it's currently happening. So that's something that even someone like me without any detailed documentation on the i965 could do.
And with a little more smarts, (from someone with more information), we could presumably reclaim buffers that the hardware was done with without having to do any waiting at all.
So it shouldn't be too long before the waiting can be eliminated or reduced to an arbitrarily small amount of time.
Results
Given these identified solutions for the current known problems, (and much of the work in progress already), the next question I want to ask is what will things look like when these are solved?
I implemented quick patches to both EXA and the i965 driver to emulate the time being spent on migration and compositing going to zero. That's not totally realistic, but is at least a best-case look at where we'll be with these problems fixed. And here's what it looks like (with the previous results repeated for comparison):
Note that in this experiment, rendered results are not at all correct, (basically, no text appears, for example).
And, still, things aren't faster than NoAccel, but there's definitely still lots of room for improvement. For example, the pixman profile shows compositing, (fbCombineInU and fbFetch_a1) that should be moved to the hardware, (particularly when the hardware is infinitely fast like it is in my emulation here!).
After that, pixman's rasterization would be at the top of the pixman profile. I've been wanting rasterization to show up at the top of a profile for a long time so I could have an excuse to implement some ideas I have for much faster software rasterization, (and to explore using the hardware for rasterization as well). And, for some applications doing much more than just rendering text, rasterization might already be a lot closer to the top.
So that shows what software operations aren't hooked up to be accelerated yet. What else is here? As I pointed out before, (and is much easier to see in this chart than the one from earlier this week), libxul is mysteriously getting slower once the i965 gets involved, but libxul really shouldn't care. So that will be something to investigate by actually building mozilla with debug symbols.
Also, there's also significantly more overhead in libexa in this chart compared to those above. So there's some room for improvement there, (ExaOffscreenMarkUsed is at the top of the profile, and as I've mentioned before it looks ripe for improvement).
Finally, the i965 driver is still burning a lot of time in its wait
function here. I'm not sure what the cause of that is this time since
I've eliminated all calls to the wait function from
i965_prepare_composite and i965_composite in this experiment.
Oh, and the big libc time in this chart is from gettimeofday, (which I showed how to eliminate earlier). That patch hasn't been accepted upstream yet, and it wasn't included in this run.
As always, I've tried to make as much data available as possible, (you can even change the .oprofile extensions on the links to .callgraph for more data---but I often can't make sense of oprofile callgraph reports myself). So I'd be glad for anybody to dig in deeper and provide any useful feedback.
Posted Fri 13 Jul 2007 02:32:49 PM PDTA couple of weeks ago I aired my confusion about a situation in which using EXA with an i965 card was 4 times slower than using NoAccel, but that there weren't any large bottlenecks visible in the profile at all, (nothing over 5%). And that didn't seem likely at all.
As is often the case this wasn't a wrong answer, but was instead a problem with me not understanding the question I had asked. I had been profiling over enttire runs of mozilla's Trender benchmark, but the 4x slowdown was based on the results it reported which measured only the inner loop of rendering itself. So my profiles including extraneous computation such as page loading that Trender was explicitly not measuring. This was actually easy to determine by simply measuring the total runtime of Trender and seeing that it slowed down by only 1.5x instead of 4x.
So to get better profiling data, I changed strategy slightly and started using an on-demand Trender technique that Vladimir offered me. It makes it easy to run a one-off Trender loop for hundreds of iterations so I can profile exactly the rendering and nothing else.
So I used that approach to measure the rendering performance of a worthwhile web page, with both NoAccel and EXA, (again with an Intel i965 card). I used my standard profile script to generate piles of data.
The trickiest part was then coming up with a reasonable way to visualize the data to try to figure out what was going on. My brother, Richard, pulled his usual HTML+CSS magic and came up with the following for me.
Note: If you click through to my blog, you'll get to see these charts
in their colorful glory. Otherwise, if you're reading this
somewhere like http://planet.gnome.org then you'll probably
just see the boring list version. But one really cool thing
about Richard's hack here is that in the absence of CSS
styling this chart does degrade nicely to just list with all the data
available. So these charts should be much more accessible than things
I've done previously with PNG bar chart images. Plus, I get to
embed hyperlinks at all the intuitive spots as well. Anyway, Richard
totally rocks for having put this together.
So there are some big percentages there---much nicer than the little 4% and 5% things I was seeing a couple of weeks ago. So, yes, it definitely helps to know that you're asking the question you mean to be. There are several links in the chart above to different profile reports. If you drill down the libc profile, you'll see that there's a lot of memcpy going on.
An easy guess is that the memcpy is due to pixmap migration due to
software fallbacks. To verify this guess, I first disabled all pixmap
migration from video memory to system memory, (which was as simple as
if (! can_accel) return; in exaDoMigration. This actually got rid of
most of the memcpy problem, and didn't cause any incorrect
rendering. Next I enabled DEBUG_TRACE_FALL in exa_priv.h to
identify all fallbacks that were getting hit by the benchmark and I
put early returns in place to disable them. Unsuprisingly, this did
cause a lot of incorrect rendering.
And of course, what we really want to do is to find what is triggering those fallbacks and accelerate them. But for now, I wanted to see how performance would be if we were already at the point that we had no software fallbacks at all. Here's what I got:
So, as hoped, a lot of the libc time went away. But there's still
a heck of a lot left, as well as kernel system-call time. That's
clearly in gettimeofday and that's easy to track down to the
I830WaitLpRing function. Fortunately, it's also extremely easy to
eliminate that system call almost entirely there. The only reason it's
being called is to ensure that we don't busy-wait forever, (due to a
video card lockup). So we could call gettimeofday only once every
several thousand iterations and still detect lockup very
quickly. Here's a
patch
to do exactly that.
So, now take a look at the performance with this patch attached:
Again, a lot of the libc time was eliminated, and a huge amount
of the kernel time was eliminated as well. But, sadly, and
dramatically, the overall performance did not improve much at all. The
time spent in the Intel driver increased not only in percentage, but
also increased in absolute timing, taking up almost all of the time
saved from libc and the kernel.
What's going on here? What's happening is that the driver is spending
an awful lot of time busy-waiting, and all we did here was to help it
busy-wait even faster. Now, we know that there aren't any software
fallbacks happening here, so what's all the waiting about? It appears
to be caused primarily by i965_prepare_composite which includes the
following comment and code:
/* Because we only have a single static buffer for our state currently,
 * we have to sync before updating it every time.
 */
i830WaitSync(pScrn);
That is, when we want to render multiple composite operations in sequence, instead of doing some nice, pipelined fire-and-forget operations, the driver is currently waiting for the previous composite operation to entirely complete before starting off another. And it's doing that waiting with CPU-burning busy-waiting.
I'll need to learn a bit more about this hardware before I can know the right way to fix this, (my, but documentation would certainly be helpful about now). For example, it would be easy to setup a circular buffer of state structures. But can I get the hardware to tell me when composite operations complete so that I can efficiently reuse those? Another approach would be to stuff the necessary compositing state into the LP ring the same way the compositing commands are being sent. Is there any reason not to do that?
Meanwhile, it looks like there's a bunch of state in the strucure that needn't be sent every time, (much of it is always constant). So there are likely easy ways to improve that as well. I'm definitely looking forward to people with more Intel-hardware-specific knowledge helping me out here, (or just plain fixing the thing).
Meanwhile, even if the driver time were completely eliminated, the rest of the time in this profile would still exceed what was spent in the NoAccel case. Some things are plainly working well, such as the fact that the pixman time has gone down. Some things are not working well, such as the new time being spent in libexa, (which appears to be mostly an inefficient approach for computing an LRU heuristic as I mentioned earlier). Some of the increased time, such as that of libc, might be related to driver problems that we hope to fix.
But one item in particular looks very strange. The libxul code is spending signficantly more time in the EXA case than in the NoAccel case, when we wouldn't expect it to be aware of the difference at all. That will be an interesting thing to track down, (and it sure would be nice if that were the biggest thing to worry about right now). But clearly we've got a lot of work to do to get the i965 performing properly with EXA.
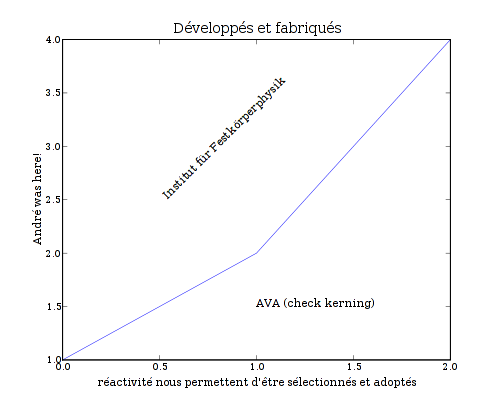
Posted Tue 10 Jul 2007 06:10:44 PM PDTThe matplotlib project looks like an interesting approach for generating charts and things. I used it (and its cairo backend, plus a couple of patches to snap lines to pixel boundaries), to generate the following chart:
That chart still isn't perfect as I'd really prefer the spacing between each of the bars to be consistent, (if you look closely at the above, you'll notice that some are spaced by 1 pixel and some are spaced by 2 pixels). Maybe that's a bug in the python script I wrote to generate the chart, (I'm totally python-clueless).
I sent the pixel-snapping patches up to the matplotlib project, so maybe they'll go somewhere.
In the meantime, there's been a recent discussion of how good matplotlib's cairo backend is compared to some of the others. Here are some files generated by the unicode_demo example script with matplotlib 0.87.7, (apparently old, as I see mention of 0.90.1 on the matplotlib website), and cairo 1.4.10 (or something very close to it). Note: This is without any of my pixel-snapping patches.
Cairo backend
PNG (19023 bytes):
PDF (15786 bytes): unicode demo-cairo.pdf
PostScript (49279 bytes): unicode demo-cairo.ps
SVG (89560 bytes):

All four of those seem to render fine for me, (with evince, gv, and rsvg-view, for example). For comparison here are files generated with other existing matplotlib backends.
AGG backend
- PNG (19769 bytes):
PDF backend
- PDF (43539): unicode demo-pdf.pdf
PS backend
- PostScript (136021 bytes): unicode demo-ps.ps
SVG backend
- SVG (7660 bytes):

Results
All of the cairo results appear to render correctly for me, (using firefox, evince, gv, and rsvg-view). The PDF generated by the builtin PDF backend renders with ? characters instead of any of the non-ASCII glyphs. Also, when rendering the SVG generated by the builtin SVG backend, the text is not scaled/positioned correctly, (the numbers overlap the axes, the title at the bottom extends beyond the right edge instead of being centered, etc.).
Meanwhile, there are a few notable deviations in size from the backends:
Using cairo for PostScript or PDF output results in a file that is 2.75x smaller than using the builtin PS or PDF backends.
Using cairo for SVG output results in a file that is more than 10 times larger, (it's actually embedding the glyph data for all of the text characters that appear in the file).
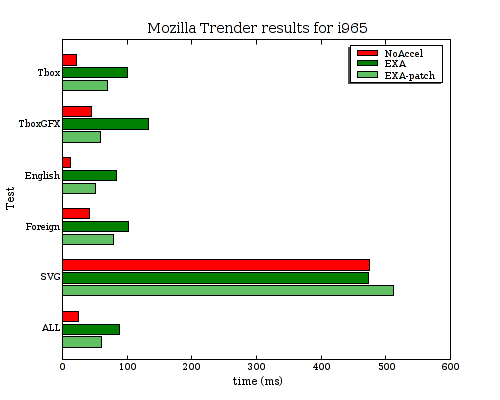
I asked for help explaining the
slow assignments that opannotate
saw in i965_prepare_composite and I got just the help I hoped
for. Peter Lund, Phillip Ezolt, Michel Dänzer, Wang Zhenyu, and Keith
Packard each provided some helpful suggestions. Thanks to each of you!
The big slowdown was due to the various bitfield assignments resulting in successive read-modify-write cycles to the uncached memory, (often to the same location!). So every read would block and force a flush of the previous write. So we were seeing abysmal performance as the CPU performed lock-step reads and writes over the AGP bus.
The simplest fix was to just setup the desired state in local buffers on the stack and to memcpy them when finished, resulting in a nice stream of AGP writes that can benefit from write-combining.
Subsequent improvements could involve not writing out data that is identical from one call of the function to the next. And it might help to rewrite the driver code to make it more clear when it is performing IO reads, (since unintentional reads can cause such performance problems by forcing a flush of pending writes).
I've published a series of "use local structure" patches in a git branch and sent that off to the xorg mailing list for review. (Update: These improvements have now been pushed out into the upstream repository for xf86-video-intel.) Here's a chart showing the improvement:
| Test | Tbox | TboxGFX | English | Foreign | SVG | ALL |
|---|---|---|---|---|---|---|
| NoAccel | 21.859 | 44.698 | 12.110 | 41.205 | 474.750 | 24.176 |
| EXA | 100.777 | 133.532 | 83.543 | 101.258 | 473.111 | 87.740 |
| EXA-patch | 69.147 | 58.795 | 51.450 | 79.048 | 511.694 | 60.086 |
So that helped a fair amount for the text-heavy tests, (although the SVG case slowed down a bit for some reason), but the overall performance is still over 4x slower than NoAccel in some cases. The profile isn't showing any single huge bottleneck anymore, but several things in the 5-8% range. Fixing things now might require a series of individual fixes that each chop another 5% problem off.
Michel also made the good suggestion that I separately profile the worst-behaving test case, so I'll pursue that next.
Posted Tue 26 Jun 2007 12:42:02 PM PDT