
Trying to get a handle on 2D graphics rendering performance can be a difficult task. Obviously, people care about the performance of their 2D applications. Nobody wants to wait for a web browser to scroll past tacky banner ads or for an email client to render a screen full of spam. And it's easy for users to notice "my programs aren't rendering as fast with the latest drivers". But what developers need is a way to quantify exactly what that means, in order to track improvements and avoid regressions. And that measurement is the hard part. Or at least it always has been hard, until Chris Wilson's recent cairo-perf-trace.
Previous attempts at 2D benchmarking
Various attempts at 2D-rendering benchmark suites have appeared and even become popular. Notable examples are x11perf and gtkperf. My claim is that these tools range from useless to actively harmful when the task is understanding performance of real applications.
These traditional benchmarks suites are collections of synthetic micro-benchmarks. Within a given benchmark, some tiny operation, (such as "render a line of text" or "draw a radio box"), is performed hundreds of times in a tight loop and the total time is measured. The hope is that these operations will simulate the workload of actual applications.
Unfortunately, the workload of things like x11perf and gtkperf rarely come close to simulating practical workloads. In the worst case, the operation being tested might never be used at all in modern applications, (notice that x11perf tests things like stippled fills and wide ellipses which are obsolete graphics operations). Similarly, even if the operation is used, (such as a GTK+ radio button), it might not represent a significant fraction of time spent rendering by the application, (which might spend most of its time drawing its primary display area rather than any stock widget).
So that's just the well-known idea to not focus on the performance of things other than the primary bottlenecks. But even when we have identified a bottleneck in an application, x11perf can still be the wrong answer for measurement. For example, "text rendering" is a common bottleneck for 2D applications. However, a test like "x11perf aa10text" which seems like a tempting way to measure text performance is far from ideal. This benchmark draws a small number of glyphs from a single font at a single size over and over. Meanwhile, a real application will use many glyphs from many fonts at many sizes. With layers and layers of caches throughout the graphics stack, it's really not possible to accurately simulate what "text rendering" means for a real application without actually just running the actual application.
And yes, I myself have used and perhaps indirectly advocated for using things like x11perf in the past. I won't recommend it again in the future. See below for what I suggest instead.
What do the 3D folks do?
For 3D performance, everybody knows this lesson already. Nobody measures the performance of "draw the same triangles over and over". And if someone does, (by seriously quoting glxgear fps numbers, for example), then everybody gets a good laugh. In fact, the phrase "glxgears is not a benchmark" is a catchphrase among 3D developers. Instead, 3D measurement is made with "benchmark modes" in the 3D applications that people actually care about, (which as far as I can tell is just games for some reason). In the benchmark mode, a sample session of recorded input is replayed as quickly as possible and a performance measurement is reported.
As a rule, our 2D applications don't have similar benchmark modes. (There are some exceptions such as the trender utility for mozilla and special command-line options for the swfdec player.) And coding up application-specific benchmarking code for every interesting application isn't something that anyone is signing up to do right now.
Introducing cairo-perf-trace
Over the past year or so, Chris "ickle" Wilson has been putting a lot of work into a debugging utility known as cairo-trace, (inspired by work on an earlier tool known as libcairowrap by Benjamin Otte and Jeff Muizelaar). The cairo-trace utility produces a trace of all cairo-based rendering operations made by an application. The trace is complete and accurate enough to allow all operations to be replayed with a separate tool.
The cairo-trace utility has long proven invaluable as a way to capture otherwise hard-to-reproduce test cases. People with complex applications that exhibit cairo bugs can generate a cairo-trace and often easily trim it down to a minimal test case. Then after submitting this trace, a developer can replicate this bug without needing to have a copy of the complex application nor its state.
More recently, Chris wrote a new "cairo-trace --profile" mode and a tool named cairo-perf-trace for replaying traces for benchmarking purposes. These tools are currently available by obtaining the cairo source code, (either from git or in the 1.9.2 development snapshot or eventually the 1.10 release or later). Hopefully we'll see them get packaged up so they're easier to use soon.
With cairo-perf-trace, it's a simple matter to get rendering performance measurements of real applications without having to do any modification of the application itself. And you can collect a trace based on exactly the workload you want, (as long as the application you are interested in performs its rendering with cairo). Simply run:
cairo-trace --profile some-application
Which will generate a compressed file named something like some-application.$pid.lzma. To later benchmark this trace, first uncompress it:
lzma -cd some-application.$pid.lzma > some-application.trace
And then run cairo-perf-trace on the trace file:
cairo-perf-trace some-application.trace
The cairo-perf-trace utility will replay several iterations of the trace, (waiting for the standard deviation among reported times to drop below a threshold), and will report timing results for both the "image" backend (cairo's software backend) and whatever native backend is compiled into cairo, (xlib, quartz, win32, etc.). So one immediately useful result is its obvious to see if the native backend is slower than the all-software backend. Then, after making changes to the graphics stack, subsequent runs can be compared to ensure regressions are avoided and performance improvements actually help.
Finally, Chris has also established a cairo-traces git repository which collects useful traces that can be shared and compared. It already contains several different browsing sessions with firefox, swfdec traces (one with youtube), and traces of poppler, gnome-terminal, and evolution. Obviously, anyone should feel free to generate and propose new traces to contribute.
Putting cairo-perf-trace to use
In the few days that cairo-perf-traces has existed, we're already seeing great results from it. When Kristian Høgsberg recently proposed a memory-saving patch for the Intel driver, Chris Wilson followed up with a cairo-perf-trace report showing that the memory-saving had no negative impact on a traced firefox session, which addressed the concern that Eric had about the patch.
As another example, we've known that there's been a performance regression in UXA (compared to EXA) for trapezoid rendering. The problem was that UXA was allocating a pixmap only to then use software-based rasterization to that pixmap (resulting in slow read-modify-write cycles). The obvious fix I implemented is to simply malloc a buffer, do the rasterization, and only then copy the result to a pixmap.
After I wrote the patch, it was very satisfying to be able to validate its real-world impact with a swfdec-based trace. This trace is based on using swfdec to view the Giant Steps movie. When running this trace, sysprof makes it obvious that trapezoid rendering is the primary bottleneck. Here is the output of cairo-perf-trace on a GM965 machine before my patch:
[ # ]  backend                         test   min(s) median(s) stddev. count
[  0]    image           swfdec-giant-steps   45.766   45.858  0.11%   6
[  0]     xlib           swfdec-giant-steps  194.422  194.602  0.05%   6
The performance problem is quite plain here. Replaying the swfdec trace to the X server takes 194 seconds compared to only 45 seconds to replay it only to cairo's all-software image backend. Note that 194 seconds is longer than the full video clip, meaning that my system isn't going to be able to keep up without skipping here. That's obviously not what we want.
Then, after my simple just-use-malloc patch I get:
[ # ]  backend                         test   min(s) median(s) stddev. count
[  0]    image           swfdec-giant-steps   45.792   46.014  0.37%   6
[  0]     xlib           swfdec-giant-steps   81.505   81.567  0.03%   6
Here the xlib result has improved from 194 seconds to 81 seconds. That's a 2.4x improvement, and fast enough to now play the movie without skipping. It's very satisfying to validate performance patches with real-world application code like this. This commit is in the recent 2.7.99.901 or the Intel driver, by the way. (Of course, there's still a 1.8x slowdown of the xlib backend compared to the image backend, so there's still more to be fixed here.)
The punchline is that we now have an easy way to benchmark 2D rendering in actual, real-world applications. If you see someone benchmarking with only toys like x11perf or gtkperf, go ahead and point them to this post, or the the cairo-perf-trace entry in the cairo FAQ, and insist on benchmarks from real applications.
Posted Fri 12 Jun 2009 05:36:41 PM PDTWith cairo's recent 1.6.4 release, we've hoped to reach the nirvana of applications that display and print documents with perfect fidelity. Unfortunately, reality isn't always as pleasant as we would like. I recently received a bug report that Firefox 3 (using cairo 1.6.4) resulted in a blurry mess when printing a very simple web page, (some text, a table, and an image). Exploring the details of this case reveals at least three independent problems that conspire to give the bad results.
Bug 1: Firefox+cairo uses image fallbacks for table borders
First, here's the simplest web page I was able to construct to show the problem, (nothing more than a single-cell table with a border): bug.html (122 bytes).
Using Firefox3 with cairo 1.6.4 on a Fedora9 system, I did a "print to file" and obtained the following PDF output: bug.pdf (14,465 bytes).
This output is still quite accurate and fairly usable. But we've already seen problem #1. Note that the file size has increased by a factor of 100 compared to the original HTML. The PDF does have more content, (firefox adds a header and footer for example), but nothing that explains such a large file. Instead, something about the way that firefox is expressing the table border is resulting in cairo putting fallback images into the resulting PDF file. So that's the first bug. I'll look closer at this, (probably with libcairowrap), and make a bug report to the mozilla folks if necessary.
Also, note that when cairo puts the fallback images into the PDF file it uses a "knockout group" to do so. This is a particular PDF construct that I'll discuss later.
Bug 2: Poppler+cairo expands knockout groups to full-page fallbacks
Next, we can use the poppler library, (with evince or a pdf2ps utility), to read the PDF file and use cairo to generate a PostScript file: bug.ps (138,067 bytes).
Notice that there has been another factor of 10 increase in the file size. Here, poppler has convinced cairo to generate a full-page fallback image rather than just the minimal fallback images present in the PDF file. This is due to the way poppler is handling the knockout group and really comes down to the difficulty of getting a single, desired result to pass through two systems with very different rendering models.
To explain a bit, (but ignoring many gory details), a PDF knockout
group can be a very complicated thing, so poppler has some fairly
sophisticated code to handle these. This support involves rendering
everything in the group twice and then using cairo's DEST_OUT and ADD
compositing operators to properly combine them. Well, PostScript can't
do fancy compositing like DEST_OUT and ADD, so of course cairo falls
back to image-based rendering for things. The irony here is that the
only reason cairo is using a knockout group in the original PDF file
is to prevent any compositing from happening, (the fallback image
needs to replace any "native" content that might appear below it). And
it turns out that painting an image without any compositing is the
only kind of image painting that PostScript knows how to do.
So, cairo is using an advanced feature of PDF to describe precisely the semantic that PostScript supports natively. The change we need is to fix poppler to recognize this case and ask for the simple thing from cairo's PostScript backend so that we don't get this full-page fallback explosion.
Bug 3: Cairo uses the wrong resolution for fallback images (in groups)
If it were only for those first two bugs, the intermediate file sizes would have been larger than normal, but the final result would have looked great and printed just fine. And in that case, I probably would have never even received a bug report.
But there's a third problem that is the most pernicious, because it results in the final result looking just awful. When cairo inserts the full-page fallback into the final PostScript file, it is inserting it at 300dpi, but it does that only after rendering it to an intermediate 72dpi image, which is then scaled up. That's why the final PostScript file appears so blurry and hard to read.
This third problem is the first I attempted to fix, (since it involves cairo alone), and I described my attempts in several posts to the cairo mailing list over the past couple of days, beginning here:
Bug with fallback resolution of groups
In that series of posts I coded a minimal test case in cairo's test suite for the resolution problem, and a patch that fixes that test case. But when I use a patched cairo for the PDF to PostScript conversion of the file described here, I end up with the following result: bug-patched-cairo.ps.
Here, there's still a giant, full-page fallback image, (this is expected since I haven't touched poppler yet). And the image is at least rendered at the correct resolution this time, (notice that the text that appears is much more sharp than in the previous PostScript file). However, the original HTML table is now entirely missing. So there's definitely something wrong with my patch.
I'll continue to chase these bugs down. The interesting thing about this chain is that it's only as strong as its weakest link. Fixing any of the individual problems here will make the end-to-end behavior be quite acceptable.
And I'll continue my quest to get high-quality display and print output from cairo-using applications. It can be a challenging goal, but it's also a lot of fun and very rewarding. Please feel free to jump in and help if you're interested.
Posted Thu 22 May 2008 12:00:55 PM PDTThe matplotlib project looks like an interesting approach for generating charts and things. I used it (and its cairo backend, plus a couple of patches to snap lines to pixel boundaries), to generate the following chart:
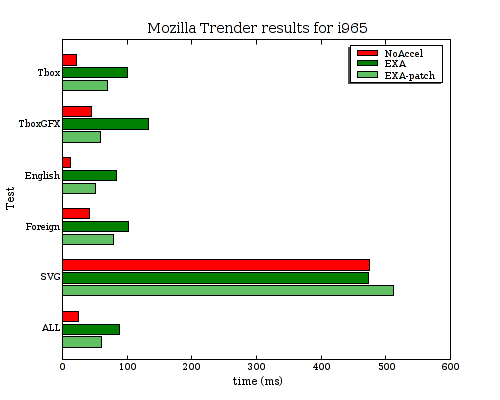
That chart still isn't perfect as I'd really prefer the spacing between each of the bars to be consistent, (if you look closely at the above, you'll notice that some are spaced by 1 pixel and some are spaced by 2 pixels). Maybe that's a bug in the python script I wrote to generate the chart, (I'm totally python-clueless).
I sent the pixel-snapping patches up to the matplotlib project, so maybe they'll go somewhere.
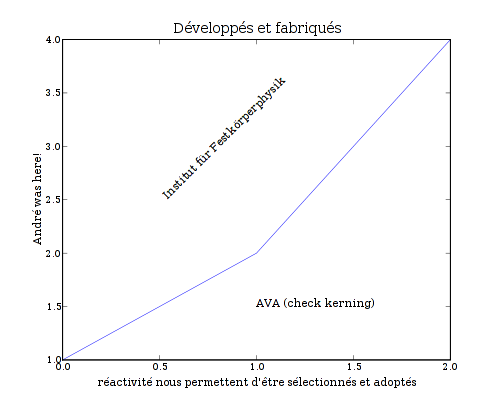
In the meantime, there's been a recent discussion of how good matplotlib's cairo backend is compared to some of the others. Here are some files generated by the unicode_demo example script with matplotlib 0.87.7, (apparently old, as I see mention of 0.90.1 on the matplotlib website), and cairo 1.4.10 (or something very close to it). Note: This is without any of my pixel-snapping patches.
Cairo backend
PNG (19023 bytes):
PDF (15786 bytes): unicode demo-cairo.pdf
PostScript (49279 bytes): unicode demo-cairo.ps
SVG (89560 bytes):

All four of those seem to render fine for me, (with evince, gv, and rsvg-view, for example). For comparison here are files generated with other existing matplotlib backends.
AGG backend
- PNG (19769 bytes):
PDF backend
- PDF (43539): unicode demo-pdf.pdf
PS backend
- PostScript (136021 bytes): unicode demo-ps.ps
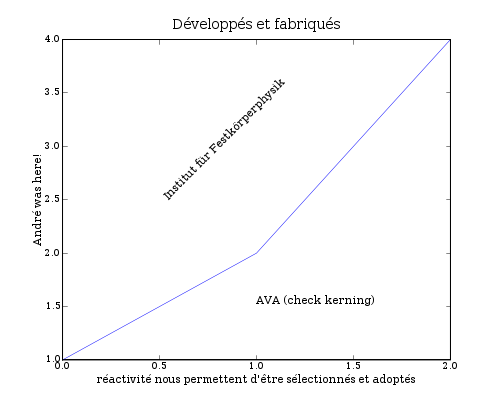
SVG backend
- SVG (7660 bytes):

Results
All of the cairo results appear to render correctly for me, (using firefox, evince, gv, and rsvg-view). The PDF generated by the builtin PDF backend renders with ? characters instead of any of the non-ASCII glyphs. Also, when rendering the SVG generated by the builtin SVG backend, the text is not scaled/positioned correctly, (the numbers overlap the axes, the title at the bottom extends beyond the right edge instead of being centered, etc.).
Meanwhile, there are a few notable deviations in size from the backends:
Using cairo for PostScript or PDF output results in a file that is 2.75x smaller than using the builtin PS or PDF backends.
Using cairo for SVG output results in a file that is more than 10 times larger, (it's actually embedding the glyph data for all of the text characters that appear in the file).
Owen Taylor was kind enough to take a close look at my [[!recent post|understanding_rectangles]] comparing the performance of EXA and NoAccel rectangle fills on an r100. He was also careful enough to notice that the results looked really fishy.
Here are some the problems he noted from looking at the graphs:
The EXA line looks to have an impossibly large fill rate
The NoAccel line looks asymptotically linear rather than quadratic as expected.
No chart of numbers was provided to allow for any closer examination.
I went back to the code for my test case and did find a bug that explains some of the problems he saw. The random positioning of rectangles wasn't correctly accounting for their size to keep them within the visible portion of the window. So, as the rectangle gets larger the region that is likely to be clipped by the destination window also gets larger. And that explains the linear rather than quadratic growth.
So here's a corrected version of the original graphs:
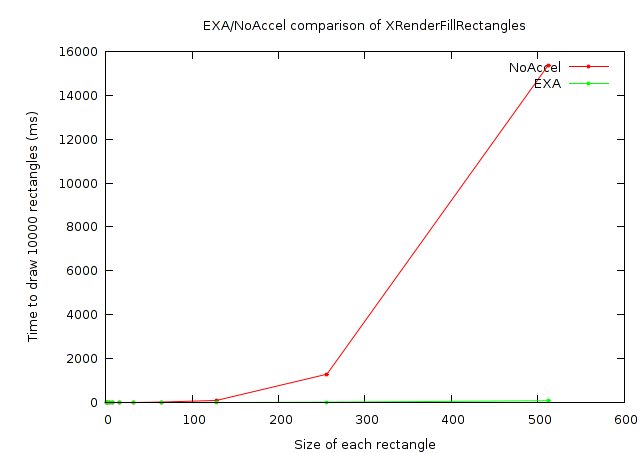
And, again, a closer look at the small rectangles:
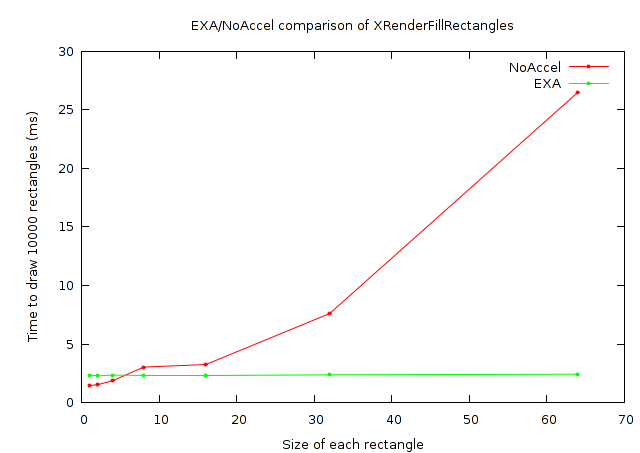
And, this time I'll provide a chart of numbers as well:
| Time to render 10000 rectangles with XRenderFillRectangles | ||
|---|---|---|
| Rectangle size | NoAccel (ms) | EXA (ms) |
| 1x1 | 1.456 | 2.356 |
| 2x2 | 1.529 | 2.288 |
| 4x4 | 1.884 | 2.352 |
| 8x8 | 3.039 | 2.356 |
| 16x16 | 3.255 | 2.357 |
| 32x32 | 7.608 | 2.377 |
| 64x64 | 26.479 | 2.430 |
| 128x128 | 101.325 | 5.376 |
| 256x256 | 1295.105 | 22.549 |
| 512x512 | 15354.022 | 89.744 |
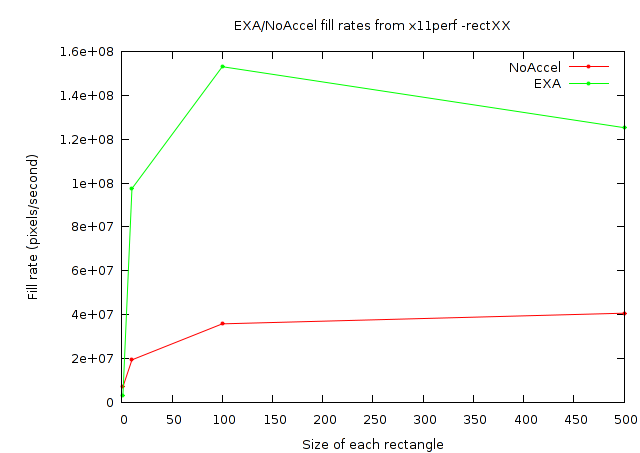
So that addresses the second and third of Owen's issues. But what
about that fill rate? First, how can I know my card's maximum fill
rate? I'm told that the standard approach is to use x11perf
-rect500. Let's see what that gives for NoAccel:
NoAccel $ x11perf -rect500
...
    900 reps @   6.1247 msec (   163.0/sec): 500x500 rectangle
And then for EXA:
$ x11perf -rect500
   3000 reps @   1.9951 msec (   501.0/sec): 500x500 rectangle
So that shows fill rates of about 41M pixels/sec for NoAccel
and about 125M pixels/sec for EXA, (500*500*163 = 40750000
and 500*500*501 = 125250000).
Meanwhile, my results above for the 10000 512x512 rectangles give fill
rates of 171M pixels/sec for NoAccel and 29210M pixels/sec for EXA,
(512*512*10000/15.354022 =~ 170733114 and 512*512*10000/.089744 =~
29210197896).
So my test is reporting a NoAccel fill rate that is 4x faster than what x11perf reports, and an EXA fill rate that is 233x (!) faster than what x11perf reports. So, something is definitely still fishy here. A fill rate of close to 30 billion pixels/sec. from an old r100 just cannot be possible, (as another datapoint, I just got a new Intel 965 and with x11perf I measure a fill rate of 843 million pixels/sec. on it).
So what could be happening here? It could be that my cairo-perf measurement framework is totally broken. It does at least seem to be returning consistent numbers from one run to the next, though. And the results do appear to have the correct trend as can be seen from these two graphs showing the measured fill rates:
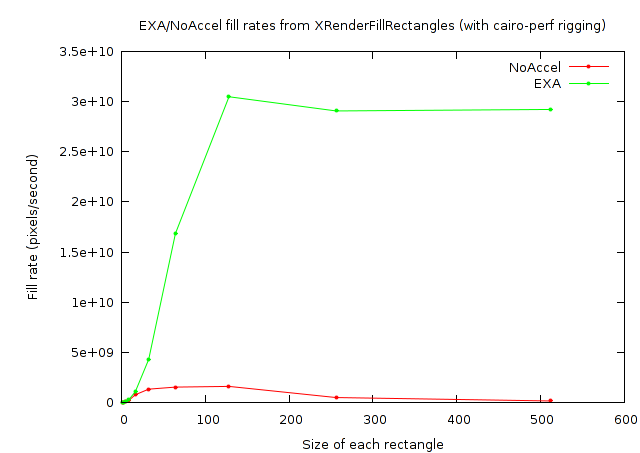
But again, notice from the Y-axis values of the cairo-perf plot that the numbers are just plain too large to be believed.
I don't yet have a good answer for what could explain the difference here. I did notice that exaPolyFillRect converts the list of rectangles into a region which should prevent areas overlapped my multiple rectangles from being filled multiple times. For x11perf there is no overlap at 100x100 or smaller, but a lot of overlap at 500x500. Similarly, the overlap gets more probable at larger sizes with the cairo-perf test. The existence of optimizations like that suggest that these tests might legitimately be able to report numbers larger than the actual fill rate of the video card.
But that code should also be common whether calling XRenderFillRectangles like my cairo-perf test does, or XFillRectangles like the x11perf test does. So that optimization doesn't explain what I'm seeing here. (I also reran my cairo-perf test with XRenderFillRectangles changed to XFillRectangles and saw no difference.)
Anybody have any ideas what might be going on here? Email me at cworth@redhat.com or the xorg list at xorg@lists.freedesktop.org, (subscription required of course).
Posted Wed 30 May 2007 01:47:18 PM PDTAbout a month ago (can it have been that long already?) I started an effort to try to baseline EXA performance on an r100 chip. A particularly alarming result from that initial test was that cairo's rectangles case was running 14 times slower with EXA than with no X server acceleration at all.
Afterwards, Eric and Dave set me straight and I got DRI working with EXA. This definitely made it faster in general, but the rectangles test was still 8x slower than NoAccel. A deeper look was necessary.
Eric had various theories about how cairo's measurement strategy could be confounding the results. What cairo's performance suite does is to perform an XGetImage of a single pixel as a synchronization barrier, (to allow the suite to wait until the X server provides the result as a guarantee that all pending rendering has occurred). One theory is that EXA could be doing something extremely inefficient here, (such as fetching the entire image instead of just a single pixel).
To alleviate this possible problem, I cranked the number of rectangles being rendered between timings from 1000 to 10000. This actually did help to some extent. After this change EXA is only 2-3x slower than NoAccel instead of 8x slower.
Also, we noticed that this slowdown only occurs when drawing to an ARGB Pixmap as opposed to drawing to an RGB Window, (when drawing to a window EXA is about 4x faster than NoAccel, whether drawing 1000 or 10000 rectangles).
So the test with 1000 rectangles was definitely measuring something undesired, since a 10x increase in the the number of rectangles resulted in something close to a 2x increase in rendering time. (For EXA to a Pixmap at least---EXA to a Window, and NoAccel to a Window or Pixmap all increased by about 10x). I'm still not sure exactly what the problem was in the case with 1000 rectangles, but the 1x1 XGetImage is still a possibility. Eric has suggested adding a new wait-for-rendering-to-complete request to the XFixes extension to eliminate the need for the 1x1 XGetImage and any problems it might be causing.
After seeing the results change so dramatically with the number of iterations, I began to wonder about batching effects. The original cairo-based rectangles test case looked about like this:
for (i = 0; i < NUM_RECTANGLES; i++) {
    cairo_rectangle (cr, rect[i].{x,y,width,height});
    cairo_fill (cr);
}
That is, each rectangle was being filled individually. I experimented
with changing this so that many calls were made to cairo_rectangle for
each call to cairo_fill. The mysterious EXA slowdown I had been
chasing went away, but only because everything became a lot slower. It
turns out there's a bad performance bug in cairo when it converts from
a list of rectangular trapezoids to a pixman_region. Cairo's pixman
doesn't expose a function for "create region from list of rectangles"
so cairo is calling a pixman_region_union function once for every
rectangle. This looks like an unnecessary O(n**2) algorithm to
me. Fortunately that should be a simple thing to fix.
So next I rewrote the test case by eliminating cairo calls and calling directly into either XRenderFillRectangles or XFillRectangle. I was shocked to find that the Render function was much slower than the non-Render function, (with no change in the X server). A little protocol tracing[*] revealed that XFillRectangle is batching requests while XRenderFillRectangles is not. That's a rather nasty trap for an unwary Xlib coder like myself. I added batching in chunks of 256 rectangles around XRenderFillRectangles and it started behaving precisely like XFillRectangles.
Finally, I eliminated some non-determinism from the rectangles test case. Originally, it was written to choose randomly-sized rectangles by independently selecting a width and height from 1 to 50. Instead I ran separate tests at power-of-2 sizes from 1 to 512. The results of doing this were quite revealing and are best seen graphically:
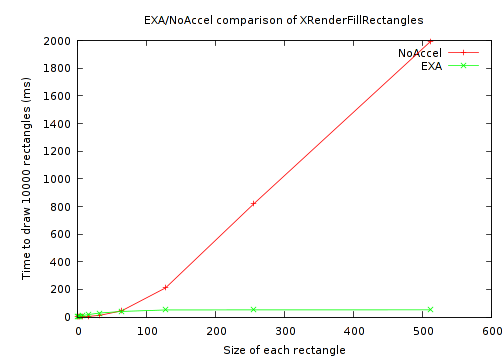
And a closer look at the small rectangles:
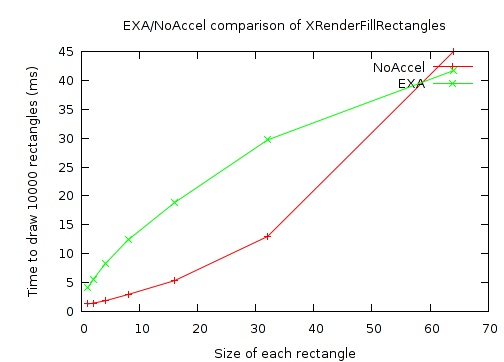
As can be seen, there's a break-even point at a rectangle size just below 60x60. Above that, EXA performance scales extremely well, with the time becoming flat based on the number of rectangles, and independent of their size. While NoAccel performance scales quite poorly (and as expected).
Meanwhile, for the small rectangles, (which my original test case just happened to be testing exclusively), EXA is 3 to 4 times slower than NoAccel. Perhaps it would make sense for the X server to take an alternate approach for these small rectangles? The NoAccel results show that the X server does have faster code already. Or perhaps EXA itself could be made faster by having some hardware state caching to reduce overhead from one rectangle to the next.
But there are some obvious questions here: What sizes actually matter? What would a rectangle-size histogram look like for typical desktop loads? There's definitely room to do some measurement work here so that we can come up with meaningful benchmarks, (rather than the fairly arbitrary things I started with), and focus on optimizing the things that really matter.
A similar issue holds for the batching issue. I only saw good performance when I batched many rectangles into each call to XRenderFillRectangles. But is that even a reasonable thing to expect applications to be able to do? Do applications actually sequentially render dozens of rectangles all of the same color? I'm imagining GTK+ widget themes with bevelled edges where it's actually much more likely that the behavior would be close to toggling back and forth between two colors every one or two rectangles. And that kind of behavior will exhibit wildly different results than what's being benchmarked here.
Anyway, there's plenty of interesting work to still be done here.
[*] I used wireshark and manually decoded all Render requests. I'm looking forward to good protocol tracing tools that decode all extensions. And yes, I'm aware of current XCB efforts to provide this---should be very nice!
Posted Wed 23 May 2007 09:40:59 AM PDT