
The matplotlib project looks like an interesting approach for generating charts and things. I used it (and its cairo backend, plus a couple of patches to snap lines to pixel boundaries), to generate the following chart:
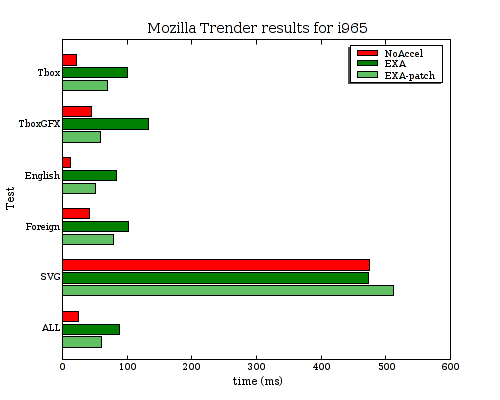
That chart still isn't perfect as I'd really prefer the spacing between each of the bars to be consistent, (if you look closely at the above, you'll notice that some are spaced by 1 pixel and some are spaced by 2 pixels). Maybe that's a bug in the python script I wrote to generate the chart, (I'm totally python-clueless).
I sent the pixel-snapping patches up to the matplotlib project, so maybe they'll go somewhere.
In the meantime, there's been a recent discussion of how good matplotlib's cairo backend is compared to some of the others. Here are some files generated by the unicode_demo example script with matplotlib 0.87.7, (apparently old, as I see mention of 0.90.1 on the matplotlib website), and cairo 1.4.10 (or something very close to it). Note: This is without any of my pixel-snapping patches.
Cairo backend
PNG (19023 bytes):
PDF (15786 bytes): unicode demo-cairo.pdf
PostScript (49279 bytes): unicode demo-cairo.ps
SVG (89560 bytes):

All four of those seem to render fine for me, (with evince, gv, and rsvg-view, for example). For comparison here are files generated with other existing matplotlib backends.
AGG backend
- PNG (19769 bytes):
PDF backend
- PDF (43539): unicode demo-pdf.pdf
PS backend
- PostScript (136021 bytes): unicode demo-ps.ps
SVG backend
- SVG (7660 bytes):

Results
All of the cairo results appear to render correctly for me, (using firefox, evince, gv, and rsvg-view). The PDF generated by the builtin PDF backend renders with ? characters instead of any of the non-ASCII glyphs. Also, when rendering the SVG generated by the builtin SVG backend, the text is not scaled/positioned correctly, (the numbers overlap the axes, the title at the bottom extends beyond the right edge instead of being centered, etc.).
Meanwhile, there are a few notable deviations in size from the backends:
Using cairo for PostScript or PDF output results in a file that is 2.75x smaller than using the builtin PS or PDF backends.
Using cairo for SVG output results in a file that is more than 10 times larger, (it's actually embedding the glyph data for all of the text characters that appear in the file).