
Here are Carl's most recent technical blog entries. More information about the blog is available.
For quite some time I've been struggling with hundreds of email messages a day, and hundreds-of-thousands of email messages in archives to search. I've used several different email programs to try to handle my mail, (pine, vm, mh-e, wanderlust, evolution, mutt), and experimented with several others, but not until now did I find one that really helps me process mail the way I want to.
Before I introduce sup, though, I want to at least mention in passing a mail indexer named mairix since I've been meaning to write a blog entry about it for several months. Anthony Towns first let me know about mairix earlier this year when I was complaining about email near him. He described his approach to mail as "mutt for reading mail and mairix for searching".
The way mairix works is that it creates an index of a mail archive then provides a command-line-based search that creates results by creating a new maildir, (with just symlinks to original messages if the original archive is also maildir-based).
So mairix can give you a simple way to add fast, full-archive searching to a program like evolution when its builtin search capability is hopelessly inadequate for your large mail archive. The mail client can be configured to look at a single search-results maildir folder, and mairix can be used to create the results there. Do note that mairix is somewhat limited as a mail search engine since it has no proximity or phrase-based searching, (the best you get is whether messages contain given words). But the maildir-in and maildir-out approach it has makes it easy to integrate, and is the kind of concept that can perhaps let us avoid some of the disasters out there in the form of monolithic email clients.
But I've got a much more interesting story in sup. I was just a few days into reinventing my email workflow around mutt when I got into an interesting conversation with Jamey Sharp about what the ideal mail-handling system would look like. Here are some of the ideas we came up with:
Program presents me with messages that need my attention, (a chronological sort of the archive with unread items in bold does not count).
When I decide a message does not need my attention I can make it "go away" into the archive, (and "mark as read" does not count---I want to file away messages but still track whether they are read or not in the archive).
Threads must be first-level objects, (in particular I want a kill-thread command that archives not only the current messages, but all future messages received in a given thread).
System should support arbitrary tags on messages. Tags can be applied automatically, (such as applying categories to mail received on lists), and applied ad-hoc by the user.
System should allow searching over the entire archive with most recent results appearing instantly. Search terms can include tags, message headers, or full-body search (including phrases).
In addition to full-archive search, incremental refinement should be possible, (a new search based on the results of a previous search).
There's no need for folders in this system. Tags and incrementally refined, tag-based searching provide all the benefits, (without the bug in folder-based systems where a user has to hunt among many folders to find one where a search returns non-empty results). In particular, the "inbox" view should just be a search for unread and non-archived messages.
That was basically our list of core features. Beyond that, we also discussed some further ideas for improving the prioritization of email threads to the user. One primary job of the system is to present the user with the most important thread to be read next, (based on tags, etc.). The user supplies feedback by either reading the thread or archiving it, so there's opportunity to apply machine learning to improve the prioritization.
During the course of this conversation, Jamey mentioned that I should go look at sup which he thought might implement some of these features, but he hadn't tried it out yet. I was delighted to find that each one of our core features already exists in sup, (and sup would make a fine platform for research into the learning-based approaches).
It also does a few things I hadn't specified, such as displaying email in a full-thread nested view, (rather than one message at a time), with quoted elements and signatures folded out of view until the user asks to see them. Another nice touch is that the single-line presentation of a thread includes the first names of participants in the thread, (with bold names to indicate unread messages). This provides some of the essential information needed for applying Joey Hess's thread patterns, but without the tree view at this point.
[Note: I have been told that several of the above features are also
implemented in gmail. I've never tried gmail myself, since it fails to
provide some even more fundamental features: 1. offline
usage, (thanks to both Mark and Greg for pointing out that gmail
has offline support in beta via gears) 2. personal ownership of email
storage, 3. free-software implementation for customization.]
In the few days I've been using sup, it's definitely transformed the way I process mail. Keeping my inbox empty is simple now, and I now easily tag messages for specific, future actions without fearing that I will forget, (and without leaving them cluttering up my inbox). Searching through my entire archive is fast---the first results come back instantly and they're generally what I want, (the index is optimized to return the most-recent messages first).
Sup is implemented in ruby, and the author and maintainers on the sup-talk mailing list have been friendly and receptive to me, (in spite of my lack of ruby-clue), so I've already got a patch or two in the upstream git repository for sup. The indexing in sup has been performed by ferret, but is currently switching to xapian.
Sup is not entirely mature yet, (I discovered fairly easy ways to make the 0.8.1 version in Debian crash), but I'm happily running the latest code from git now, and trusting my mail to it. I did find that a bug in a dependent package causes sup to crash when running sup from git while sup is also installed from the Debian package. So I recommend doing "apt-get install sup-mail" to get the dependencies installed, then "apt-get remove sup-mail" (but don't autoremove the dependencies), then run sup from:
git clone git://gitorious.org/sup/mainline.git
I've also posted a short list of some changes I'd like to see in sup, (mostly in the client stuff---the indexing and searching stuff seems just fine).
There's a nice New User's Guide included with sup, but no reference manual yet, so the sup wiki is an essential (and short) substitute for a reference manual for now.
One thing sup does not do yet is that it doesn't separate the mail-indexing/tagging/searching system from the mail client. So if you're not happy with a curses client written in ruby, (and perhaps more significantly, a different client than what you're currently using for composing messages, making attachments, viewing mime stuff, etc.) then you're currently out of luck. Fortunately, William Morgan has plans to reinvent the most interesting aspects of sup as a server process and he recently reported making progress on those plans over the last year. (This isn't too surprising, since why would William want to maintain all that code to do things like dealing with mbox, maildir, attachments, etc. when those are already solved problems for users everywhere.)
And hey, I would love to have a mailing list archiver based on sup's threading. So if anyone wants to cook something like that up, please feel free, (sup is licensed under the GNU GPLv2).
Posted Thu 20 Aug 2009 04:30:00 PM PDTTrying to get a handle on 2D graphics rendering performance can be a difficult task. Obviously, people care about the performance of their 2D applications. Nobody wants to wait for a web browser to scroll past tacky banner ads or for an email client to render a screen full of spam. And it's easy for users to notice "my programs aren't rendering as fast with the latest drivers". But what developers need is a way to quantify exactly what that means, in order to track improvements and avoid regressions. And that measurement is the hard part. Or at least it always has been hard, until Chris Wilson's recent cairo-perf-trace.
Previous attempts at 2D benchmarking
Various attempts at 2D-rendering benchmark suites have appeared and even become popular. Notable examples are x11perf and gtkperf. My claim is that these tools range from useless to actively harmful when the task is understanding performance of real applications.
These traditional benchmarks suites are collections of synthetic micro-benchmarks. Within a given benchmark, some tiny operation, (such as "render a line of text" or "draw a radio box"), is performed hundreds of times in a tight loop and the total time is measured. The hope is that these operations will simulate the workload of actual applications.
Unfortunately, the workload of things like x11perf and gtkperf rarely come close to simulating practical workloads. In the worst case, the operation being tested might never be used at all in modern applications, (notice that x11perf tests things like stippled fills and wide ellipses which are obsolete graphics operations). Similarly, even if the operation is used, (such as a GTK+ radio button), it might not represent a significant fraction of time spent rendering by the application, (which might spend most of its time drawing its primary display area rather than any stock widget).
So that's just the well-known idea to not focus on the performance of things other than the primary bottlenecks. But even when we have identified a bottleneck in an application, x11perf can still be the wrong answer for measurement. For example, "text rendering" is a common bottleneck for 2D applications. However, a test like "x11perf aa10text" which seems like a tempting way to measure text performance is far from ideal. This benchmark draws a small number of glyphs from a single font at a single size over and over. Meanwhile, a real application will use many glyphs from many fonts at many sizes. With layers and layers of caches throughout the graphics stack, it's really not possible to accurately simulate what "text rendering" means for a real application without actually just running the actual application.
And yes, I myself have used and perhaps indirectly advocated for using things like x11perf in the past. I won't recommend it again in the future. See below for what I suggest instead.
What do the 3D folks do?
For 3D performance, everybody knows this lesson already. Nobody measures the performance of "draw the same triangles over and over". And if someone does, (by seriously quoting glxgear fps numbers, for example), then everybody gets a good laugh. In fact, the phrase "glxgears is not a benchmark" is a catchphrase among 3D developers. Instead, 3D measurement is made with "benchmark modes" in the 3D applications that people actually care about, (which as far as I can tell is just games for some reason). In the benchmark mode, a sample session of recorded input is replayed as quickly as possible and a performance measurement is reported.
As a rule, our 2D applications don't have similar benchmark modes. (There are some exceptions such as the trender utility for mozilla and special command-line options for the swfdec player.) And coding up application-specific benchmarking code for every interesting application isn't something that anyone is signing up to do right now.
Introducing cairo-perf-trace
Over the past year or so, Chris "ickle" Wilson has been putting a lot of work into a debugging utility known as cairo-trace, (inspired by work on an earlier tool known as libcairowrap by Benjamin Otte and Jeff Muizelaar). The cairo-trace utility produces a trace of all cairo-based rendering operations made by an application. The trace is complete and accurate enough to allow all operations to be replayed with a separate tool.
The cairo-trace utility has long proven invaluable as a way to capture otherwise hard-to-reproduce test cases. People with complex applications that exhibit cairo bugs can generate a cairo-trace and often easily trim it down to a minimal test case. Then after submitting this trace, a developer can replicate this bug without needing to have a copy of the complex application nor its state.
More recently, Chris wrote a new "cairo-trace --profile" mode and a tool named cairo-perf-trace for replaying traces for benchmarking purposes. These tools are currently available by obtaining the cairo source code, (either from git or in the 1.9.2 development snapshot or eventually the 1.10 release or later). Hopefully we'll see them get packaged up so they're easier to use soon.
With cairo-perf-trace, it's a simple matter to get rendering performance measurements of real applications without having to do any modification of the application itself. And you can collect a trace based on exactly the workload you want, (as long as the application you are interested in performs its rendering with cairo). Simply run:
cairo-trace --profile some-application
Which will generate a compressed file named something like some-application.$pid.lzma. To later benchmark this trace, first uncompress it:
lzma -cd some-application.$pid.lzma > some-application.trace
And then run cairo-perf-trace on the trace file:
cairo-perf-trace some-application.trace
The cairo-perf-trace utility will replay several iterations of the trace, (waiting for the standard deviation among reported times to drop below a threshold), and will report timing results for both the "image" backend (cairo's software backend) and whatever native backend is compiled into cairo, (xlib, quartz, win32, etc.). So one immediately useful result is its obvious to see if the native backend is slower than the all-software backend. Then, after making changes to the graphics stack, subsequent runs can be compared to ensure regressions are avoided and performance improvements actually help.
Finally, Chris has also established a cairo-traces git repository which collects useful traces that can be shared and compared. It already contains several different browsing sessions with firefox, swfdec traces (one with youtube), and traces of poppler, gnome-terminal, and evolution. Obviously, anyone should feel free to generate and propose new traces to contribute.
Putting cairo-perf-trace to use
In the few days that cairo-perf-traces has existed, we're already seeing great results from it. When Kristian Høgsberg recently proposed a memory-saving patch for the Intel driver, Chris Wilson followed up with a cairo-perf-trace report showing that the memory-saving had no negative impact on a traced firefox session, which addressed the concern that Eric had about the patch.
As another example, we've known that there's been a performance regression in UXA (compared to EXA) for trapezoid rendering. The problem was that UXA was allocating a pixmap only to then use software-based rasterization to that pixmap (resulting in slow read-modify-write cycles). The obvious fix I implemented is to simply malloc a buffer, do the rasterization, and only then copy the result to a pixmap.
After I wrote the patch, it was very satisfying to be able to validate its real-world impact with a swfdec-based trace. This trace is based on using swfdec to view the Giant Steps movie. When running this trace, sysprof makes it obvious that trapezoid rendering is the primary bottleneck. Here is the output of cairo-perf-trace on a GM965 machine before my patch:
[ # ]  backend                         test   min(s) median(s) stddev. count
[  0]    image           swfdec-giant-steps   45.766   45.858  0.11%   6
[  0]     xlib           swfdec-giant-steps  194.422  194.602  0.05%   6
The performance problem is quite plain here. Replaying the swfdec trace to the X server takes 194 seconds compared to only 45 seconds to replay it only to cairo's all-software image backend. Note that 194 seconds is longer than the full video clip, meaning that my system isn't going to be able to keep up without skipping here. That's obviously not what we want.
Then, after my simple just-use-malloc patch I get:
[ # ]  backend                         test   min(s) median(s) stddev. count
[  0]    image           swfdec-giant-steps   45.792   46.014  0.37%   6
[  0]     xlib           swfdec-giant-steps   81.505   81.567  0.03%   6
Here the xlib result has improved from 194 seconds to 81 seconds. That's a 2.4x improvement, and fast enough to now play the movie without skipping. It's very satisfying to validate performance patches with real-world application code like this. This commit is in the recent 2.7.99.901 or the Intel driver, by the way. (Of course, there's still a 1.8x slowdown of the xlib backend compared to the image backend, so there's still more to be fixed here.)
The punchline is that we now have an easy way to benchmark 2D rendering in actual, real-world applications. If you see someone benchmarking with only toys like x11perf or gtkperf, go ahead and point them to this post, or the the cairo-perf-trace entry in the cairo FAQ, and insist on benchmarks from real applications.
Posted Fri 12 Jun 2009 05:36:41 PM PDTIt's hard for me to believe that my last technical post on the progress of the Intel graphics driver was nearly a year ago. Certainly, a lot has happened in that year, and recent developments have been covered well by Keith, Eric, and Jesse. So I won't go into any of those details, but I do want to give my impression of where things stand.
As my colleagues have described so well, a major restructuring of the driver is now complete, (KMS, GEM, dri2, removal of XAA, EXA, dri1, etc.). This restructuring caused months of upheaval, followed by months of stabilization during which many bugs were shaken out. The end result is that the primary developers are all optimistic about the current state of the driver. Things seem better than ever.
In the meantime, however, it's also obvious that some users are not happy with the driver, and some have gotten the impression that the quality is getting consistently worse with time. Some have theorized that no quality-assurance testing is happening, or that the developers just plain don't care about regressions. Neither of those theories are true, so why is there such a disconnect between the developers and the users?
One reason for unhappy users is the lag between development happening and users getting their hands on the code. So the phase of upheaval and instability might be behind the developers, but some users are just entering into it. This is exacerbated by the fact that the major restructuring puts several important components of the driver into the kernel. It used to be that getting the latest Intel driver just meant updating an xf86-video-intel module or upgrading an xserver-xorg-video-intel package. But now it's essential to get a recent kernel as well, (note that almost all of the major fixes that Eric describes happened in the kernel, not the user-level driver). And these fixes aren't in a major kernel release until 2.6.30 which appeared only today.
In addition, distributions and users have a tendency to update the kernel less frequently than user-level components. So when a user checks out the latest xf86-video-intel from git, (without a kernel upgrade), not only is that user not getting the "latest driver" as recommended by the developers, but they might also be running a combination that the developers and QA never saw nor tested.
For example, I recently attempted to run the latest-from-git Intel driver with a kernel version as installed by current Debian installation CDs. This kernel is ancient with respect to our driver development (2.6.25 I think). What I found was that the X server would not start at all. Obviously, we had neglected to test this particular combination, (so yes, QA isn't perfect---but it also can't cover the infinite number of possible combinations). Fortunately, the fix was simple, and appears in the 2.7.99.901 snapshot I just released (today!) so will appear in the 2.8.0 release very soon.
The packagers of X for Ubuntu have been working hard to address this exact problem of the lag between developers and users. They've setup a repository of packages named xorg-edgers where users can easily get packages built directly from git. I don't think it includes the kernel yet, as it will soon hopefully, but this is definitely a step in the right direction. Update: It does include a 2.6.30 kernel now---maybe all that time I spent writing this blog post wasn't wasted after all.
But what about the users that did upgrade their kernel and driver and are still seeing some major problems? In this case, we really want to hear from you. We take pride in our work and are committed to doing our best to make quality releases without regressions. When you hit some awful behavior, (GPU hang, scrambled mode, abysmal performance), it may be that you're just hitting a combination of components or application behavior that we've never seen before. We want those details and we want to fix the problem. File good bug reports and please make use of the "regression" keyword as appropriate. We pay attention to that.
Performance regressions are an especially important issue. In fact, performance is so important that I'll make a separate post about that. I've got some exciting news to share about performance measurement.
Posted Wed 10 Jun 2009 04:29:07 PM PDT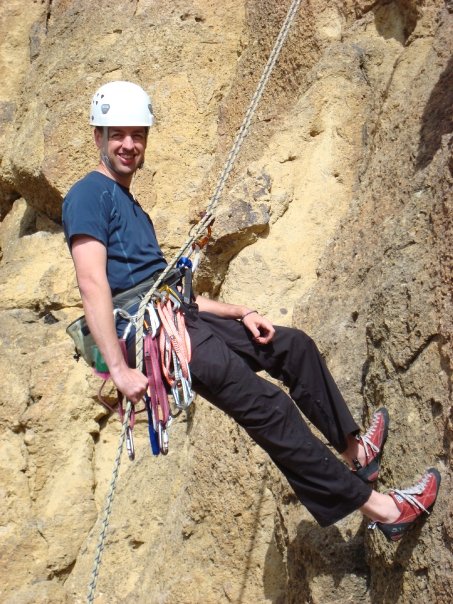
In June of 2008 I started rock climbing at a local gym, and instantly got hooked. I still can't fully explain the fascination I have with climbing, but it certainly includes an aspect of solving a three-dimensional puzzle. When I started, the easiest routes in the gym (graded 5.7) were difficult for me, but satisfying.
Within a few months I had already acquired a fair amount of gear, and I had the chance to climb outdoors (on toprope) with a good friend, (Scott DV), who was rediscovering climbing, (having climbed in Idaho years ago). We both found that there is some fine climbing to be had in the Portland area. We were just disappointed that we hadn't started sooner, because Oregon's wet season soon started interfering with outdoor climbing.
I got through the winter months by being lucky enough to find a climbing partner, (Scott D), willing to train with me 3 times a week, (and helping to motivate me to get up at ridiculously early hours to climb before work). We both took technique classes that took our climbing up a notch. By the time we were ticking off routes at 5.9, we took lead-climbing class and starting leading in the gym in January 2009.
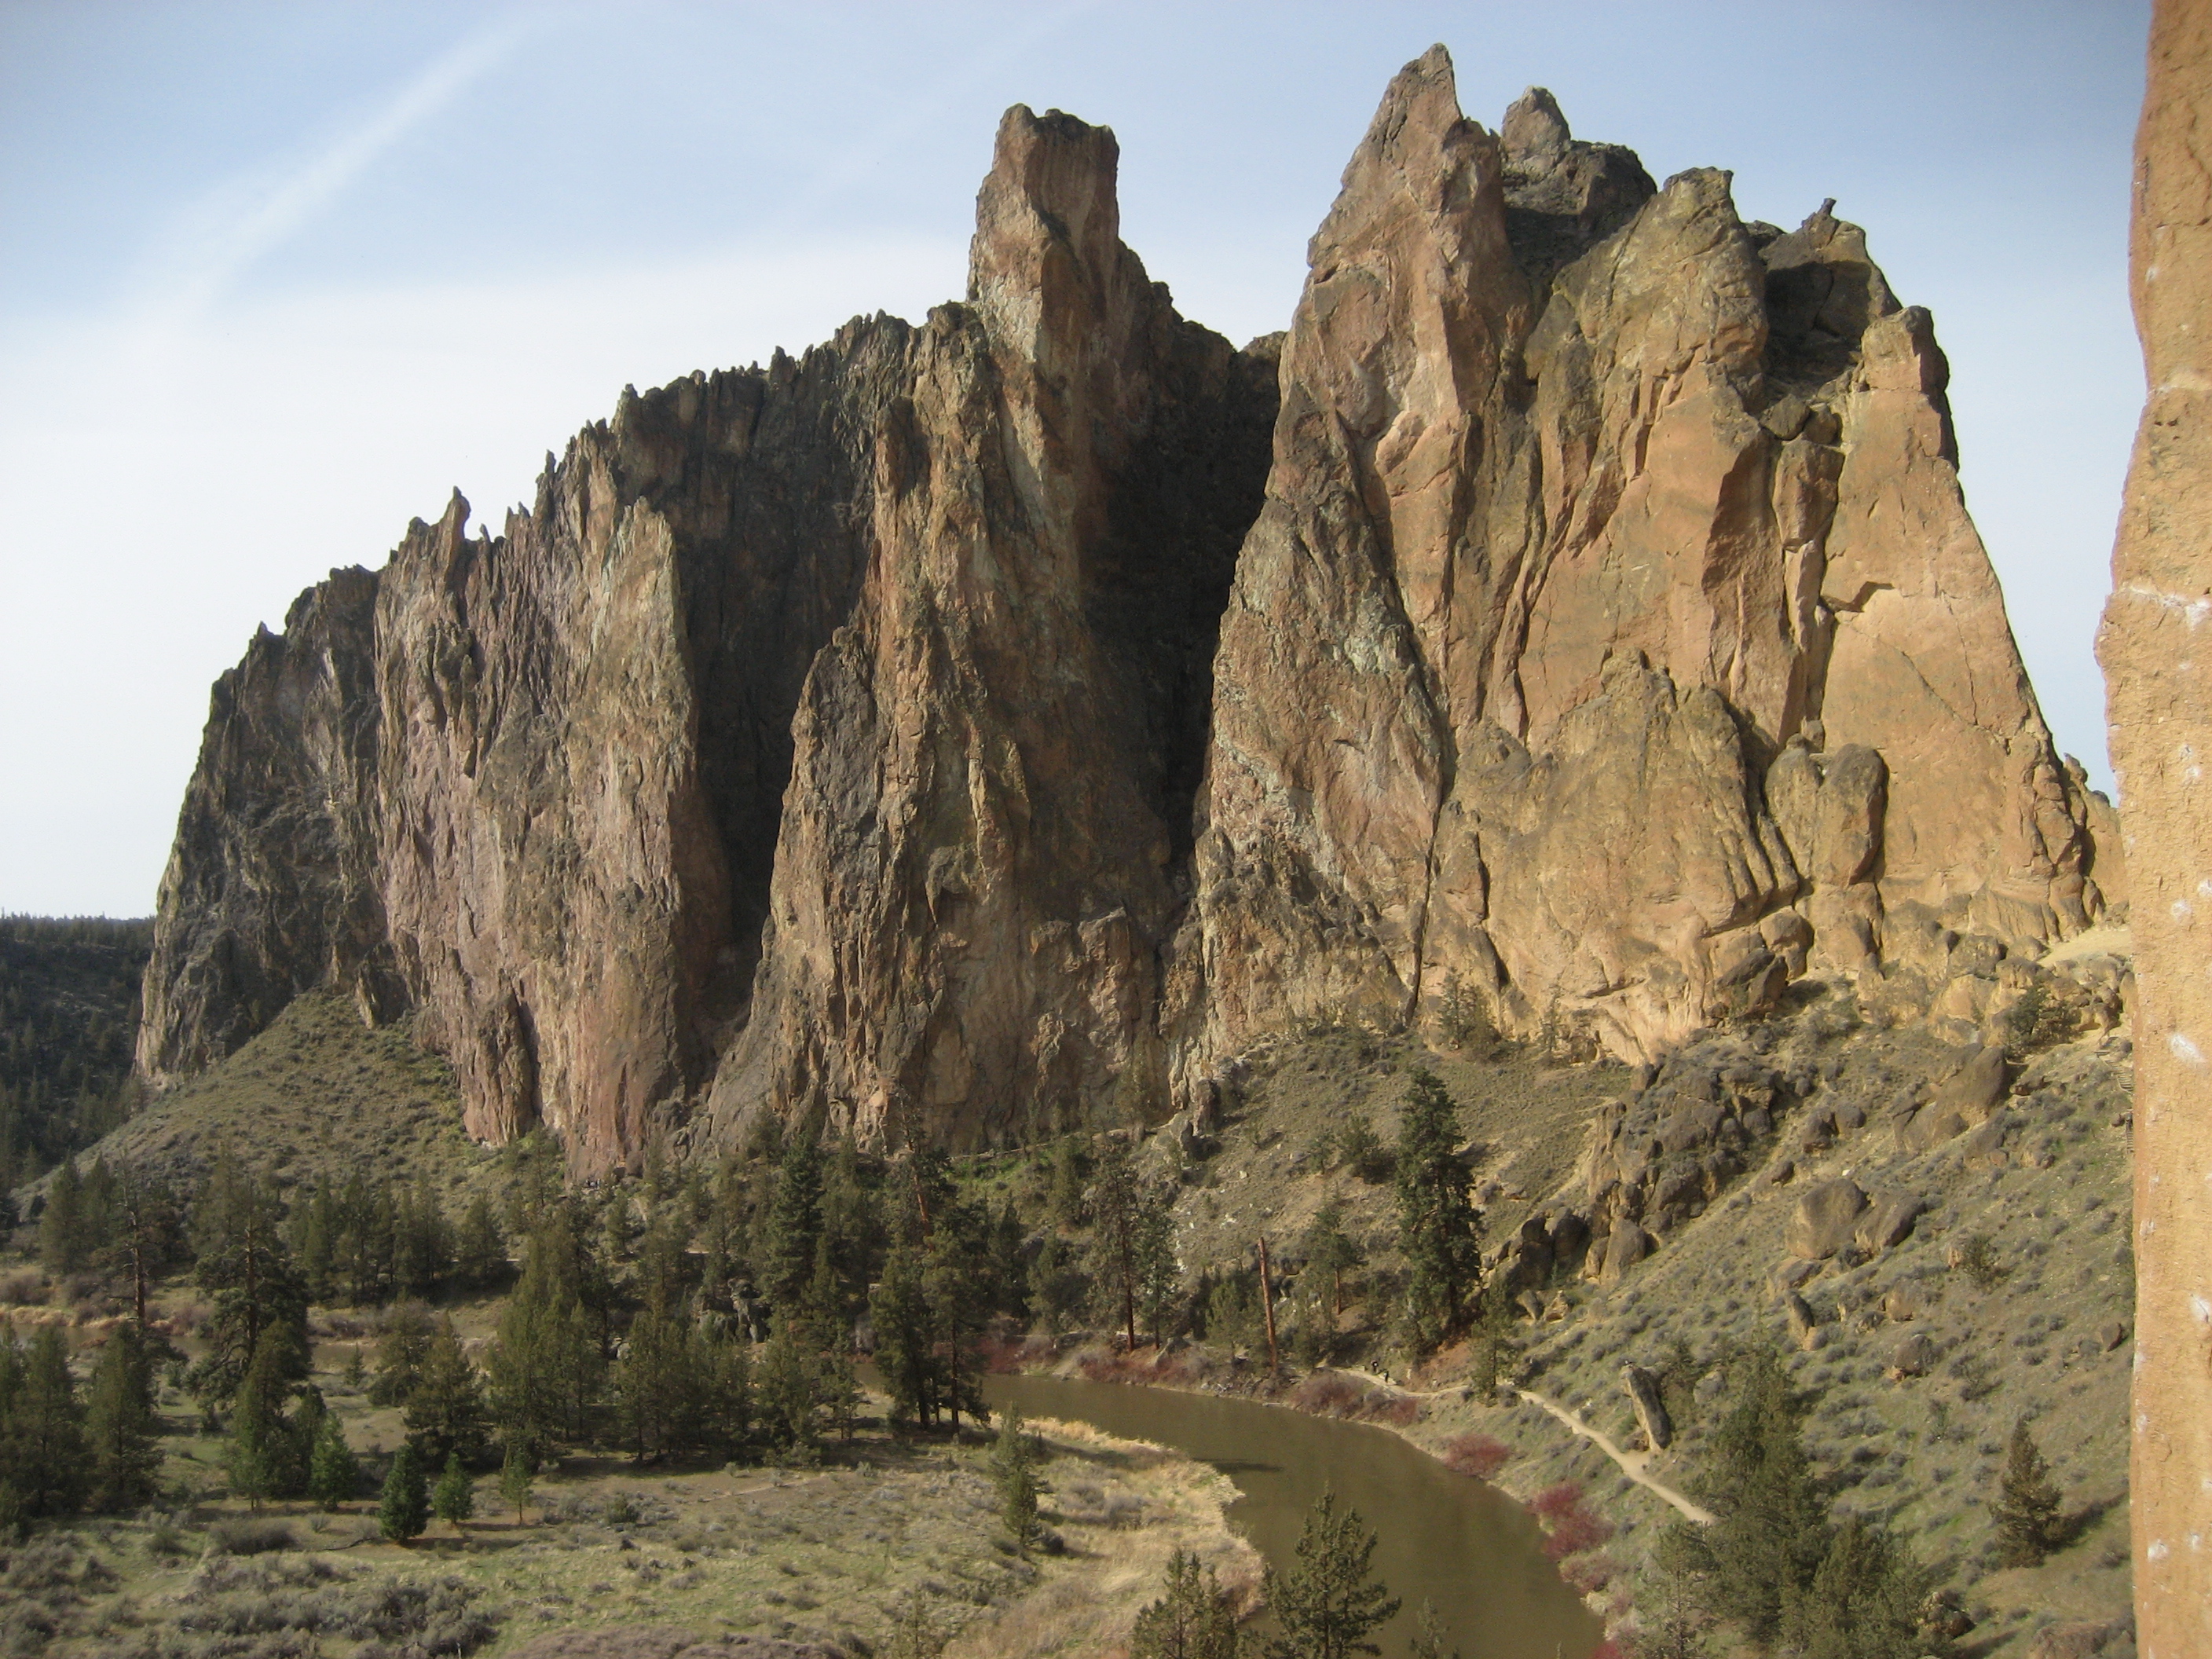
An unseasonably cold and wet month of March kept us in the gym, where we kept at our routine, leading at 5.8/5.9 and toproping at 5.10- (with several 5.10+ projects). In April, the sun finally came out and we took the first chance we could to get outdoors with a road trip to Smith Rock and some of the best climbing in Oregon. Our first experience leading outdoors was very satisfying, (and very different than in the gym), with each of us succeeding at 5.8 leads.
Back at the gym two days later, we decided that if we're going to start leading at 5.9, we'd better be working 5.11 in the gym. So we started working our first 5.11- project. It was grueling, (and we didn't make it through the crux without cheating with some weight on the rope), but we did get to the top, and it was a blast.
One of my favorite things about climbing is that the routes are graded on an open-ended scale. It's fantastic to know that no matter how much I improve there will always be routes ready to punish me and put me back in my place.
Posted Wed 22 Apr 2009 12:19:40 PM PDT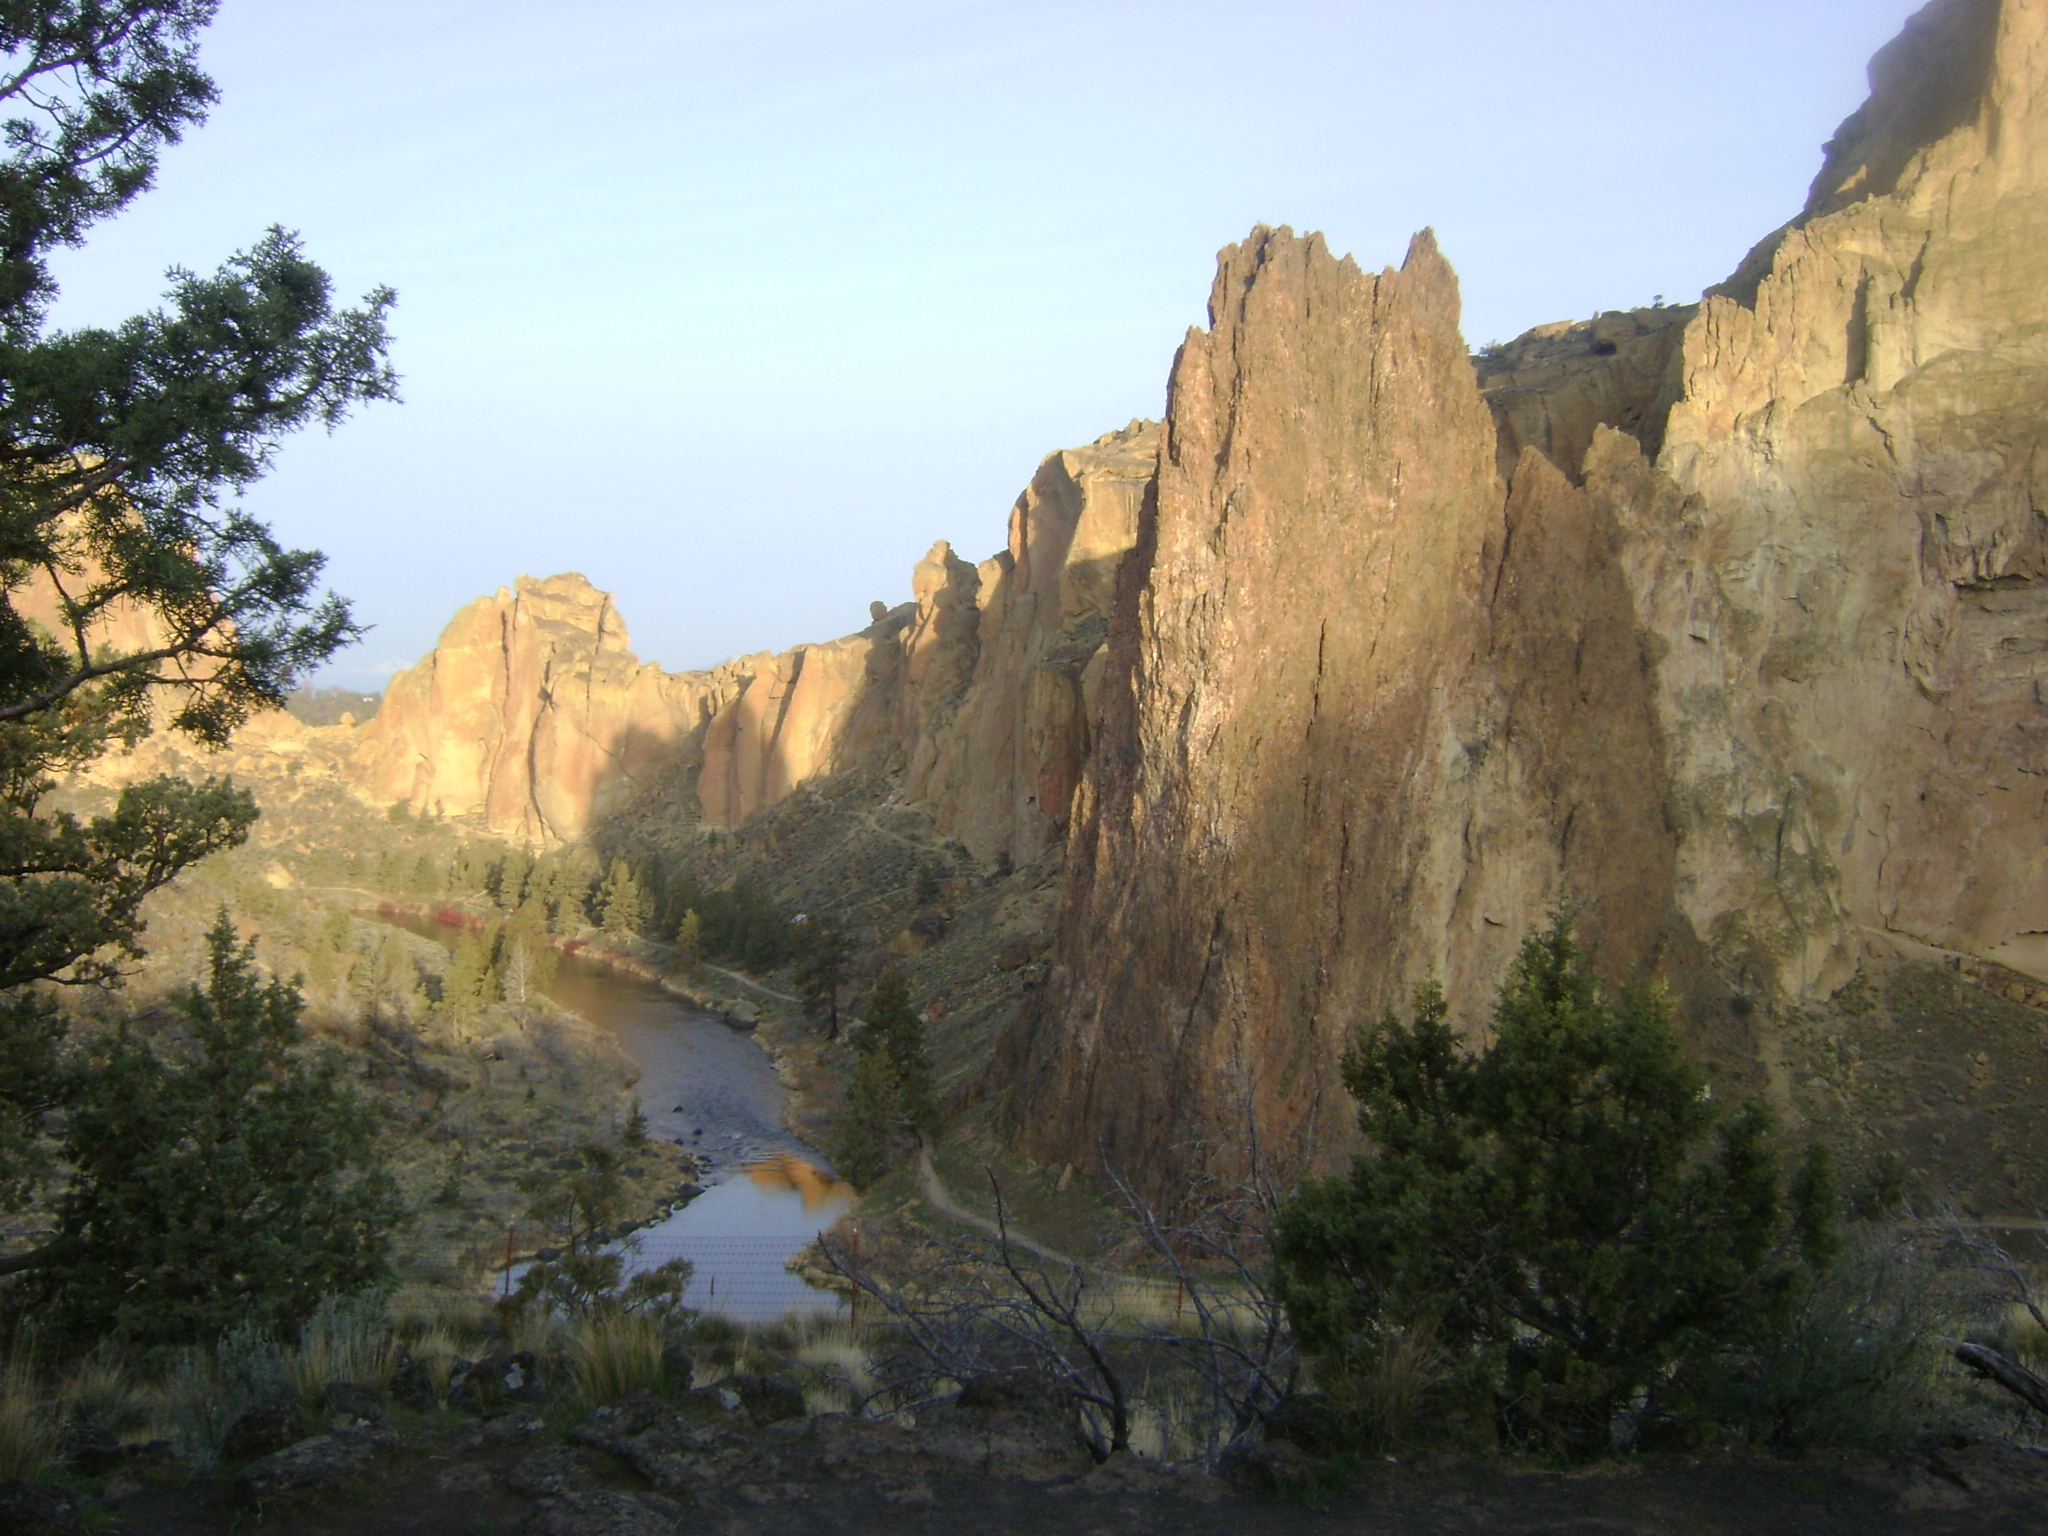
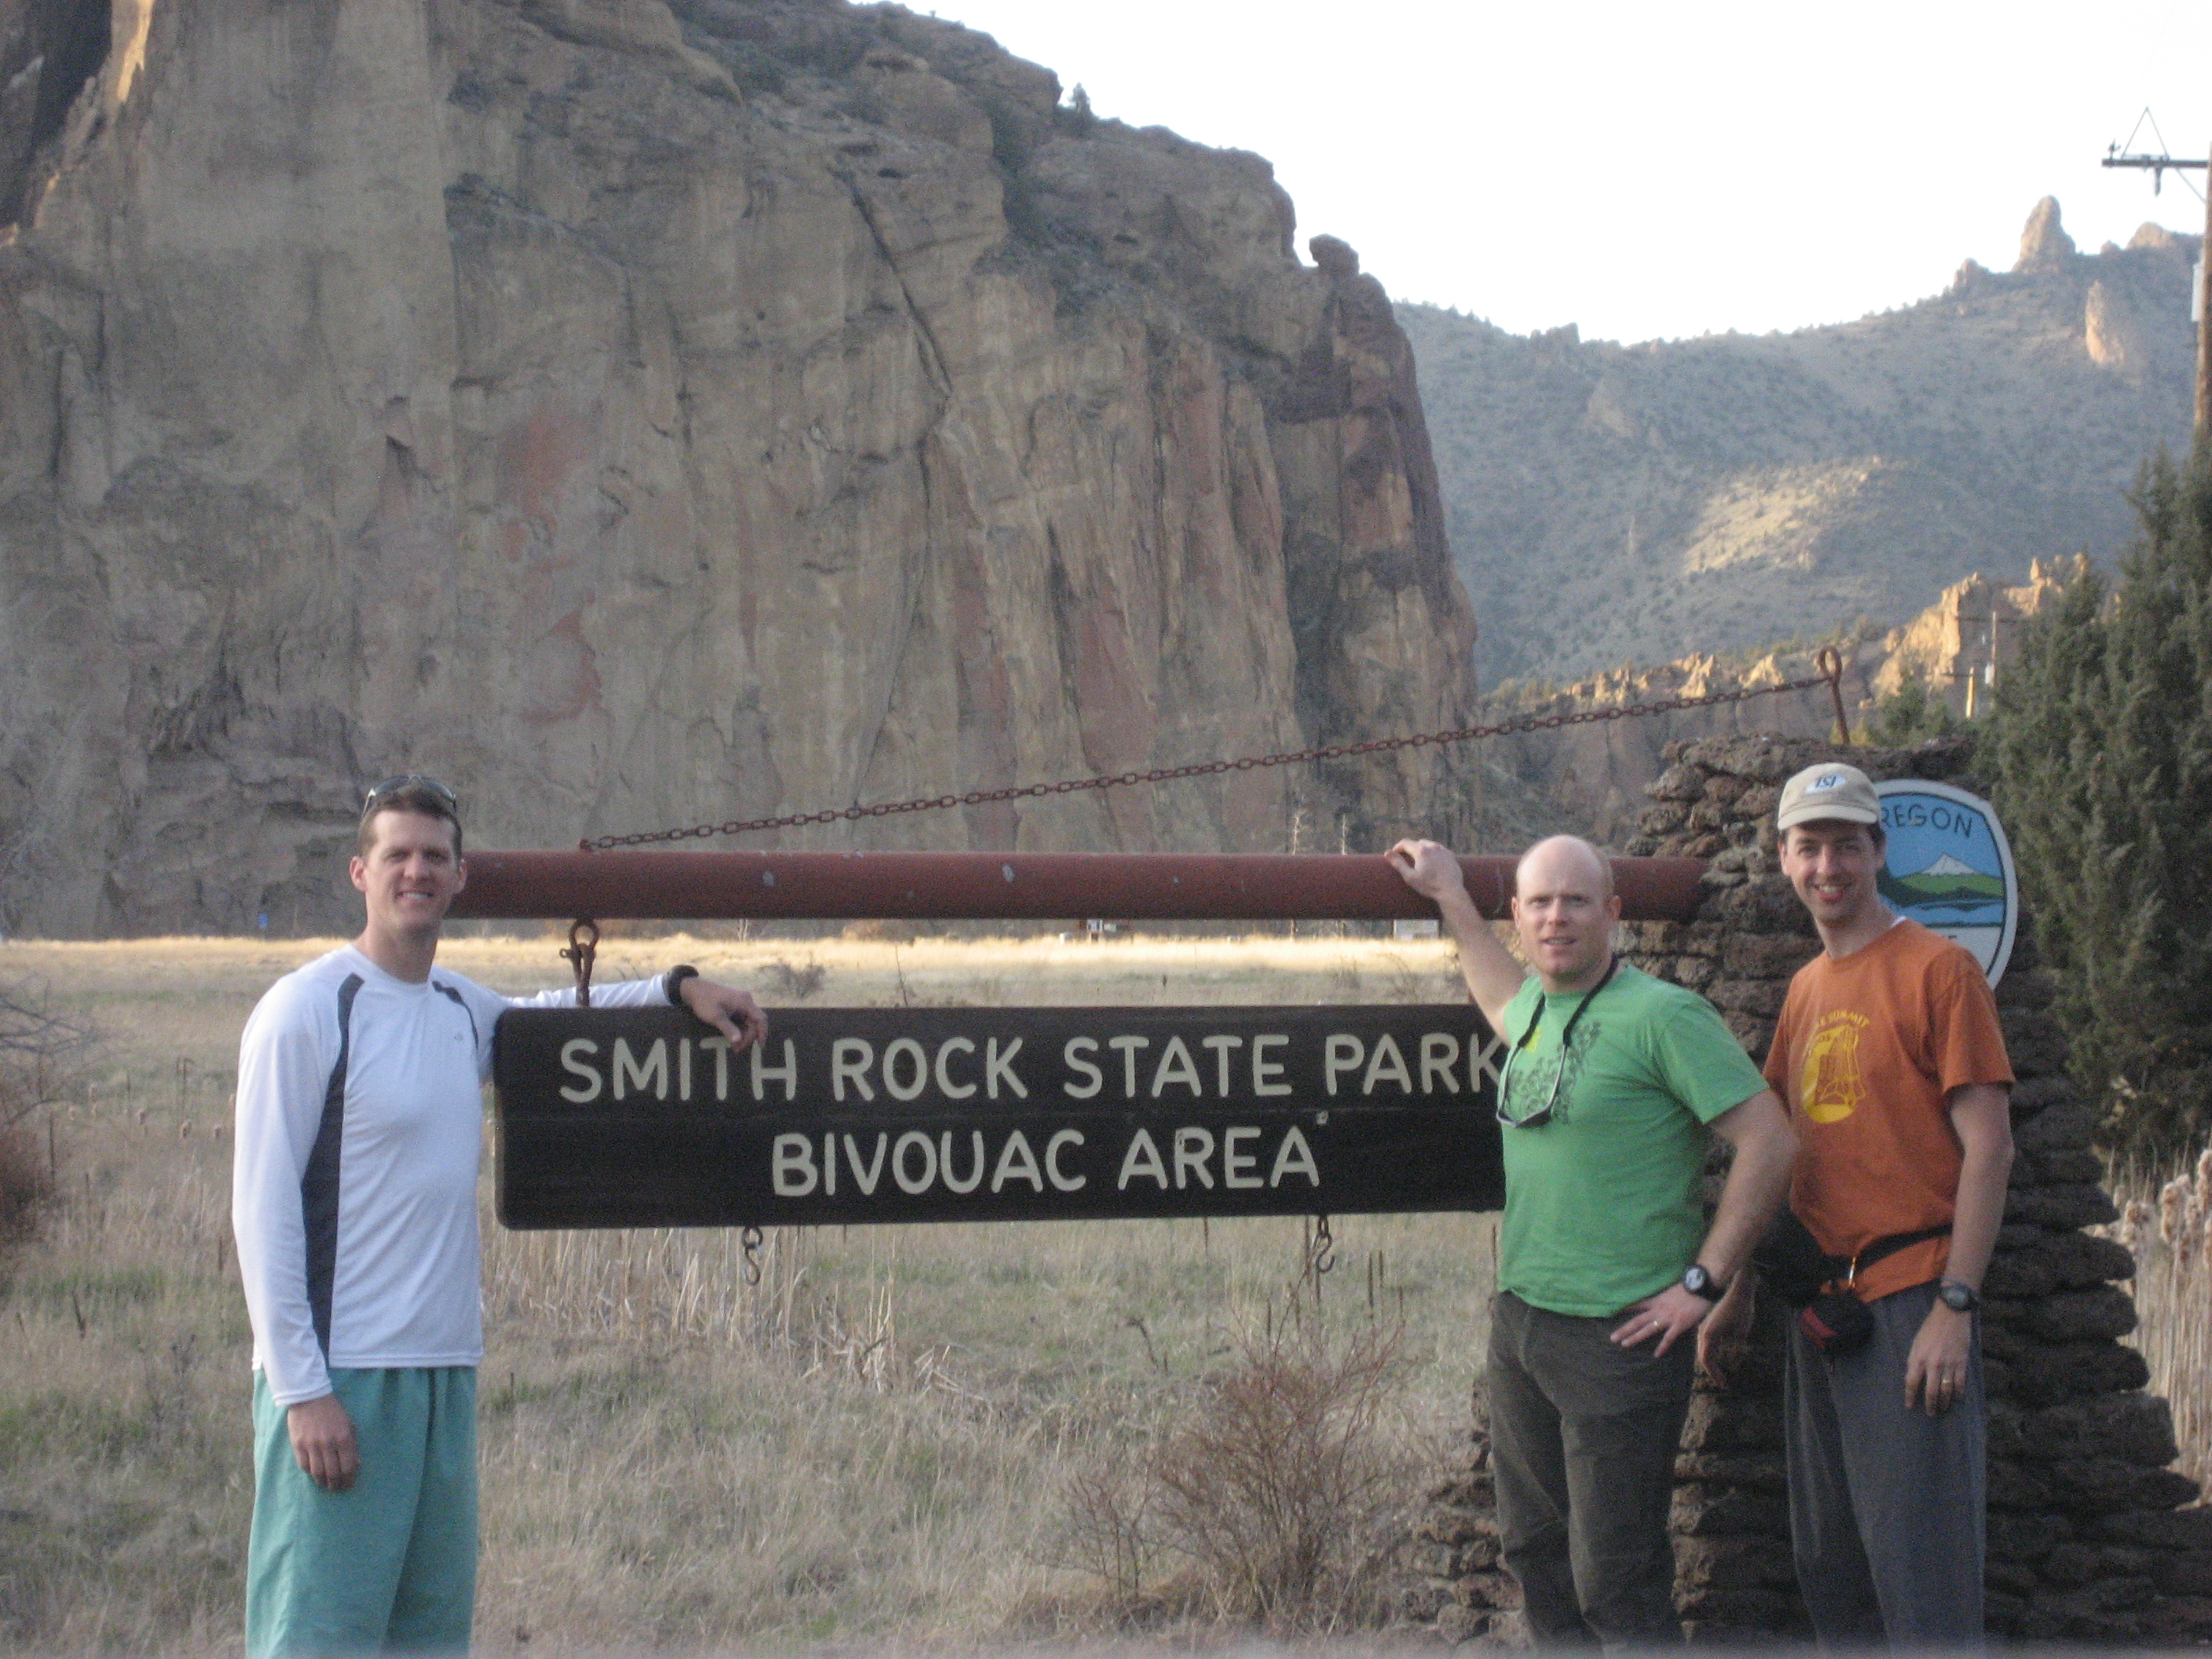
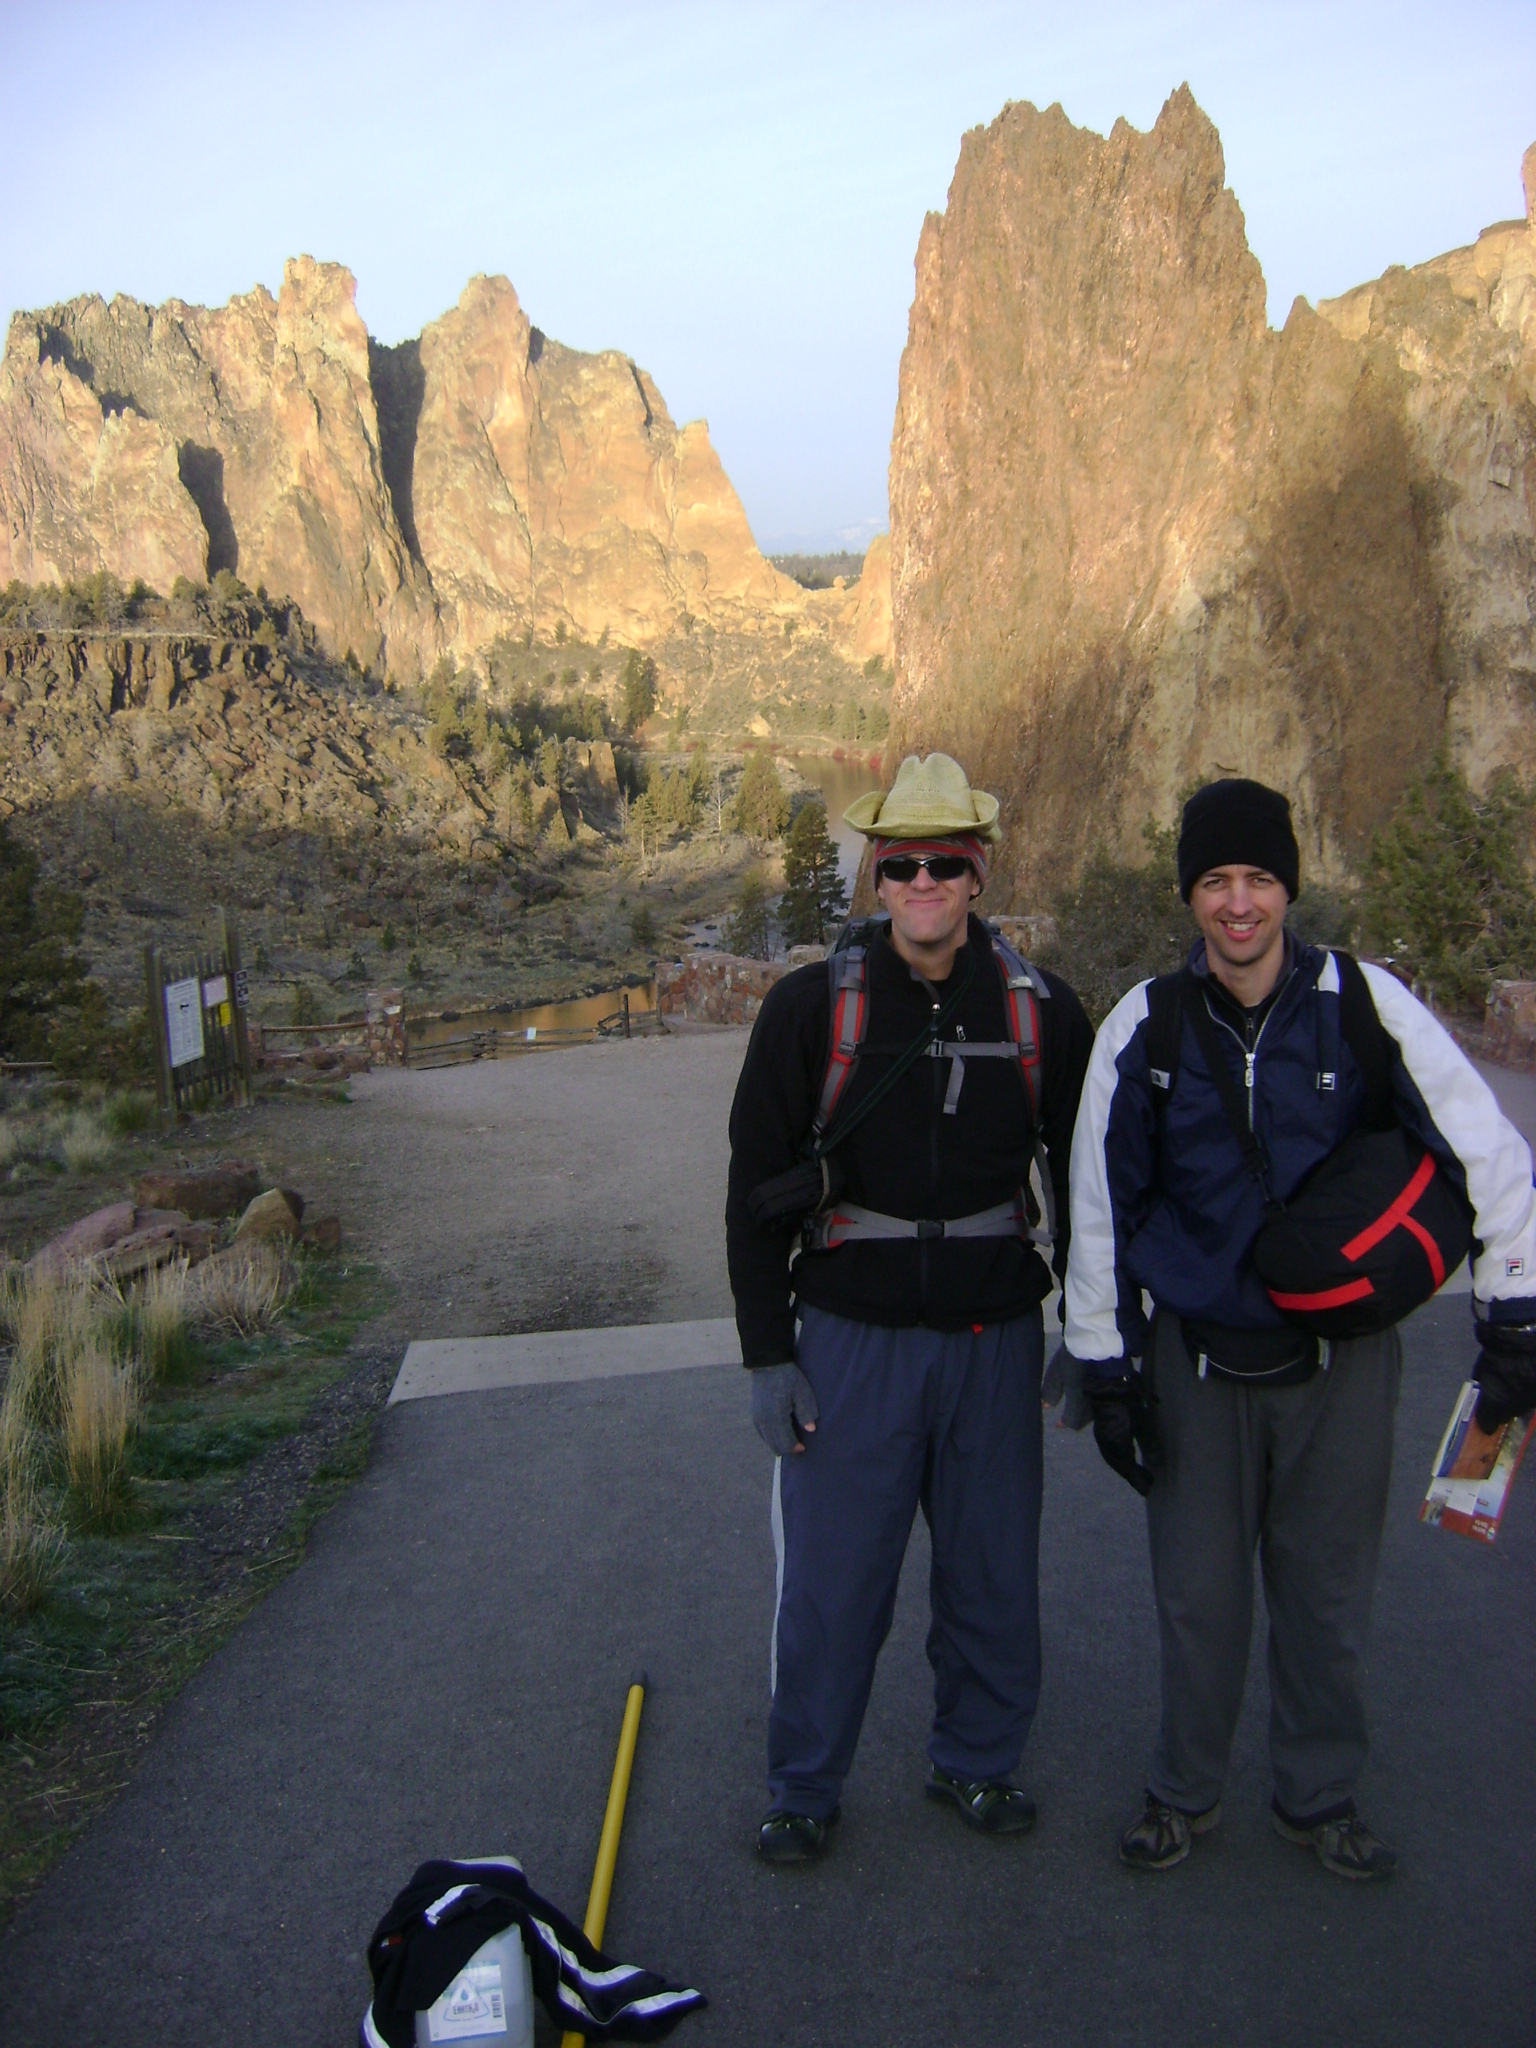
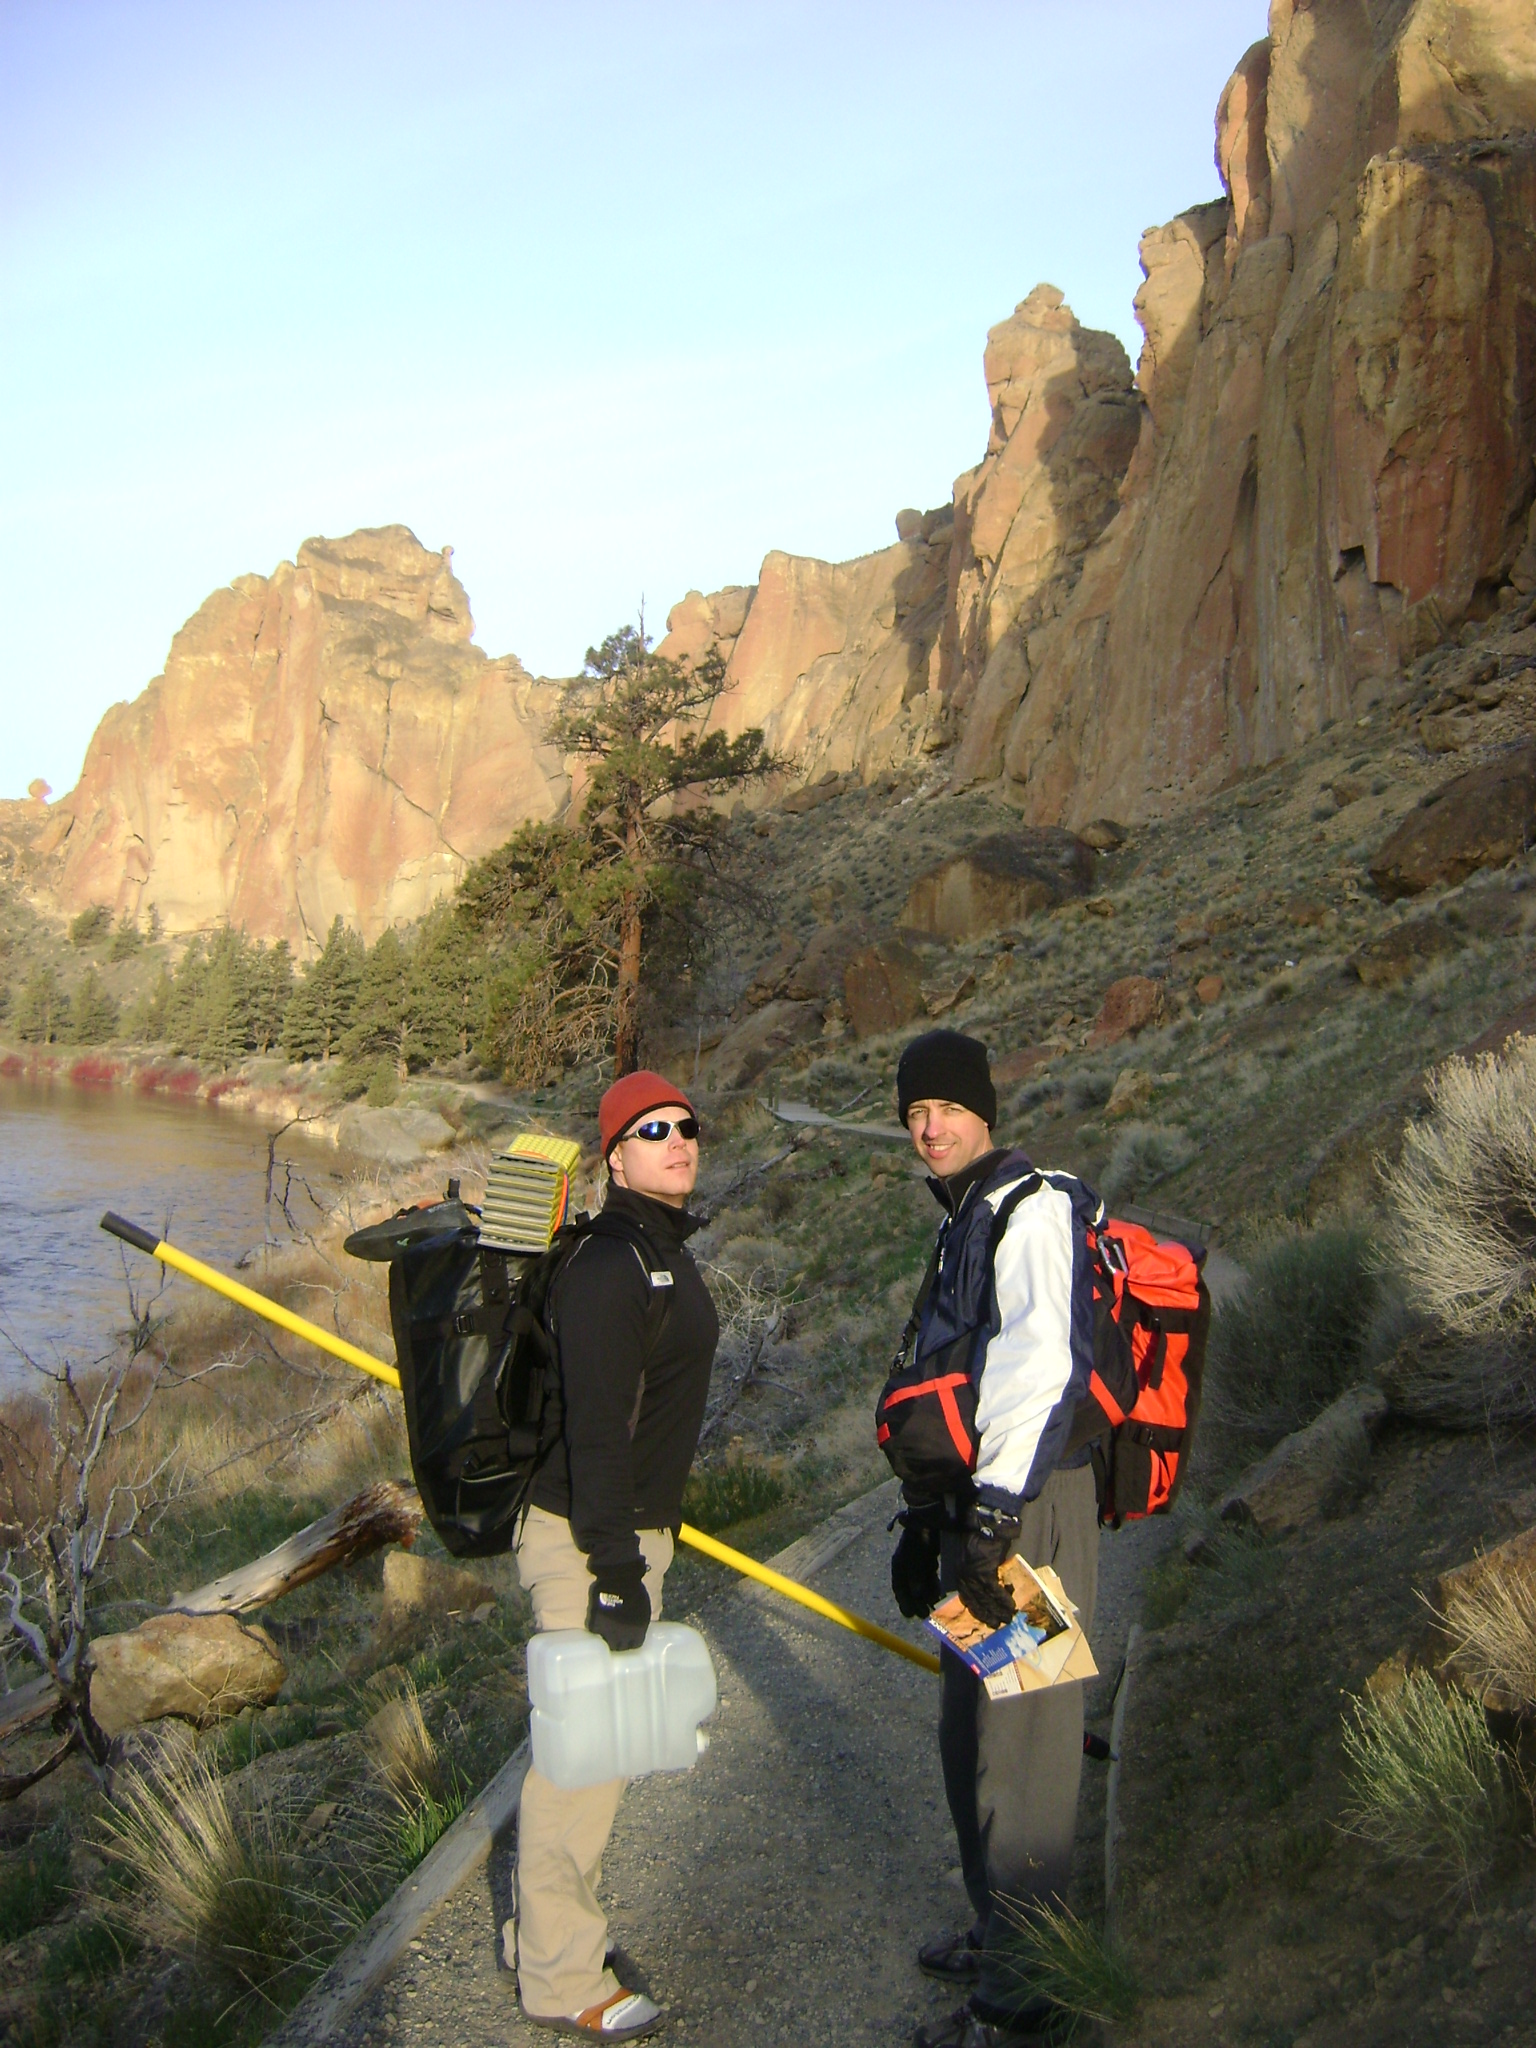
We had a fantastic time on our first climbing trip to Smith Rock. We drove down on Friday and camped at the base of the rock. Scott D. was anxious to beat the rush and set an alarm for 5:00 AM. When that alarm went off it was still quite dark and the temperature was just below freezing(!). The thought of ice-cold rock on bare hands was enough to keep us in our warm sleeping bags for a while longer, but eventually we did bundle up for the approach hike to the rock.
We got onto the rock at about the same time the sunshine did, and fortunately it warmed the rock very quickly. In fact, by afternoon we were desperate for shade to escape the heat. Large temperature swings are expected in the desert, of course, (note: next time, remind everyone to at least pack some socks). Getting to the rock early did work out quite well. We didn't see another climber for over an hour, so we had the chance to choose any route we wanted. Later in the day the most popular routes had lines long enough to make things feel a little bit like Disneyland.
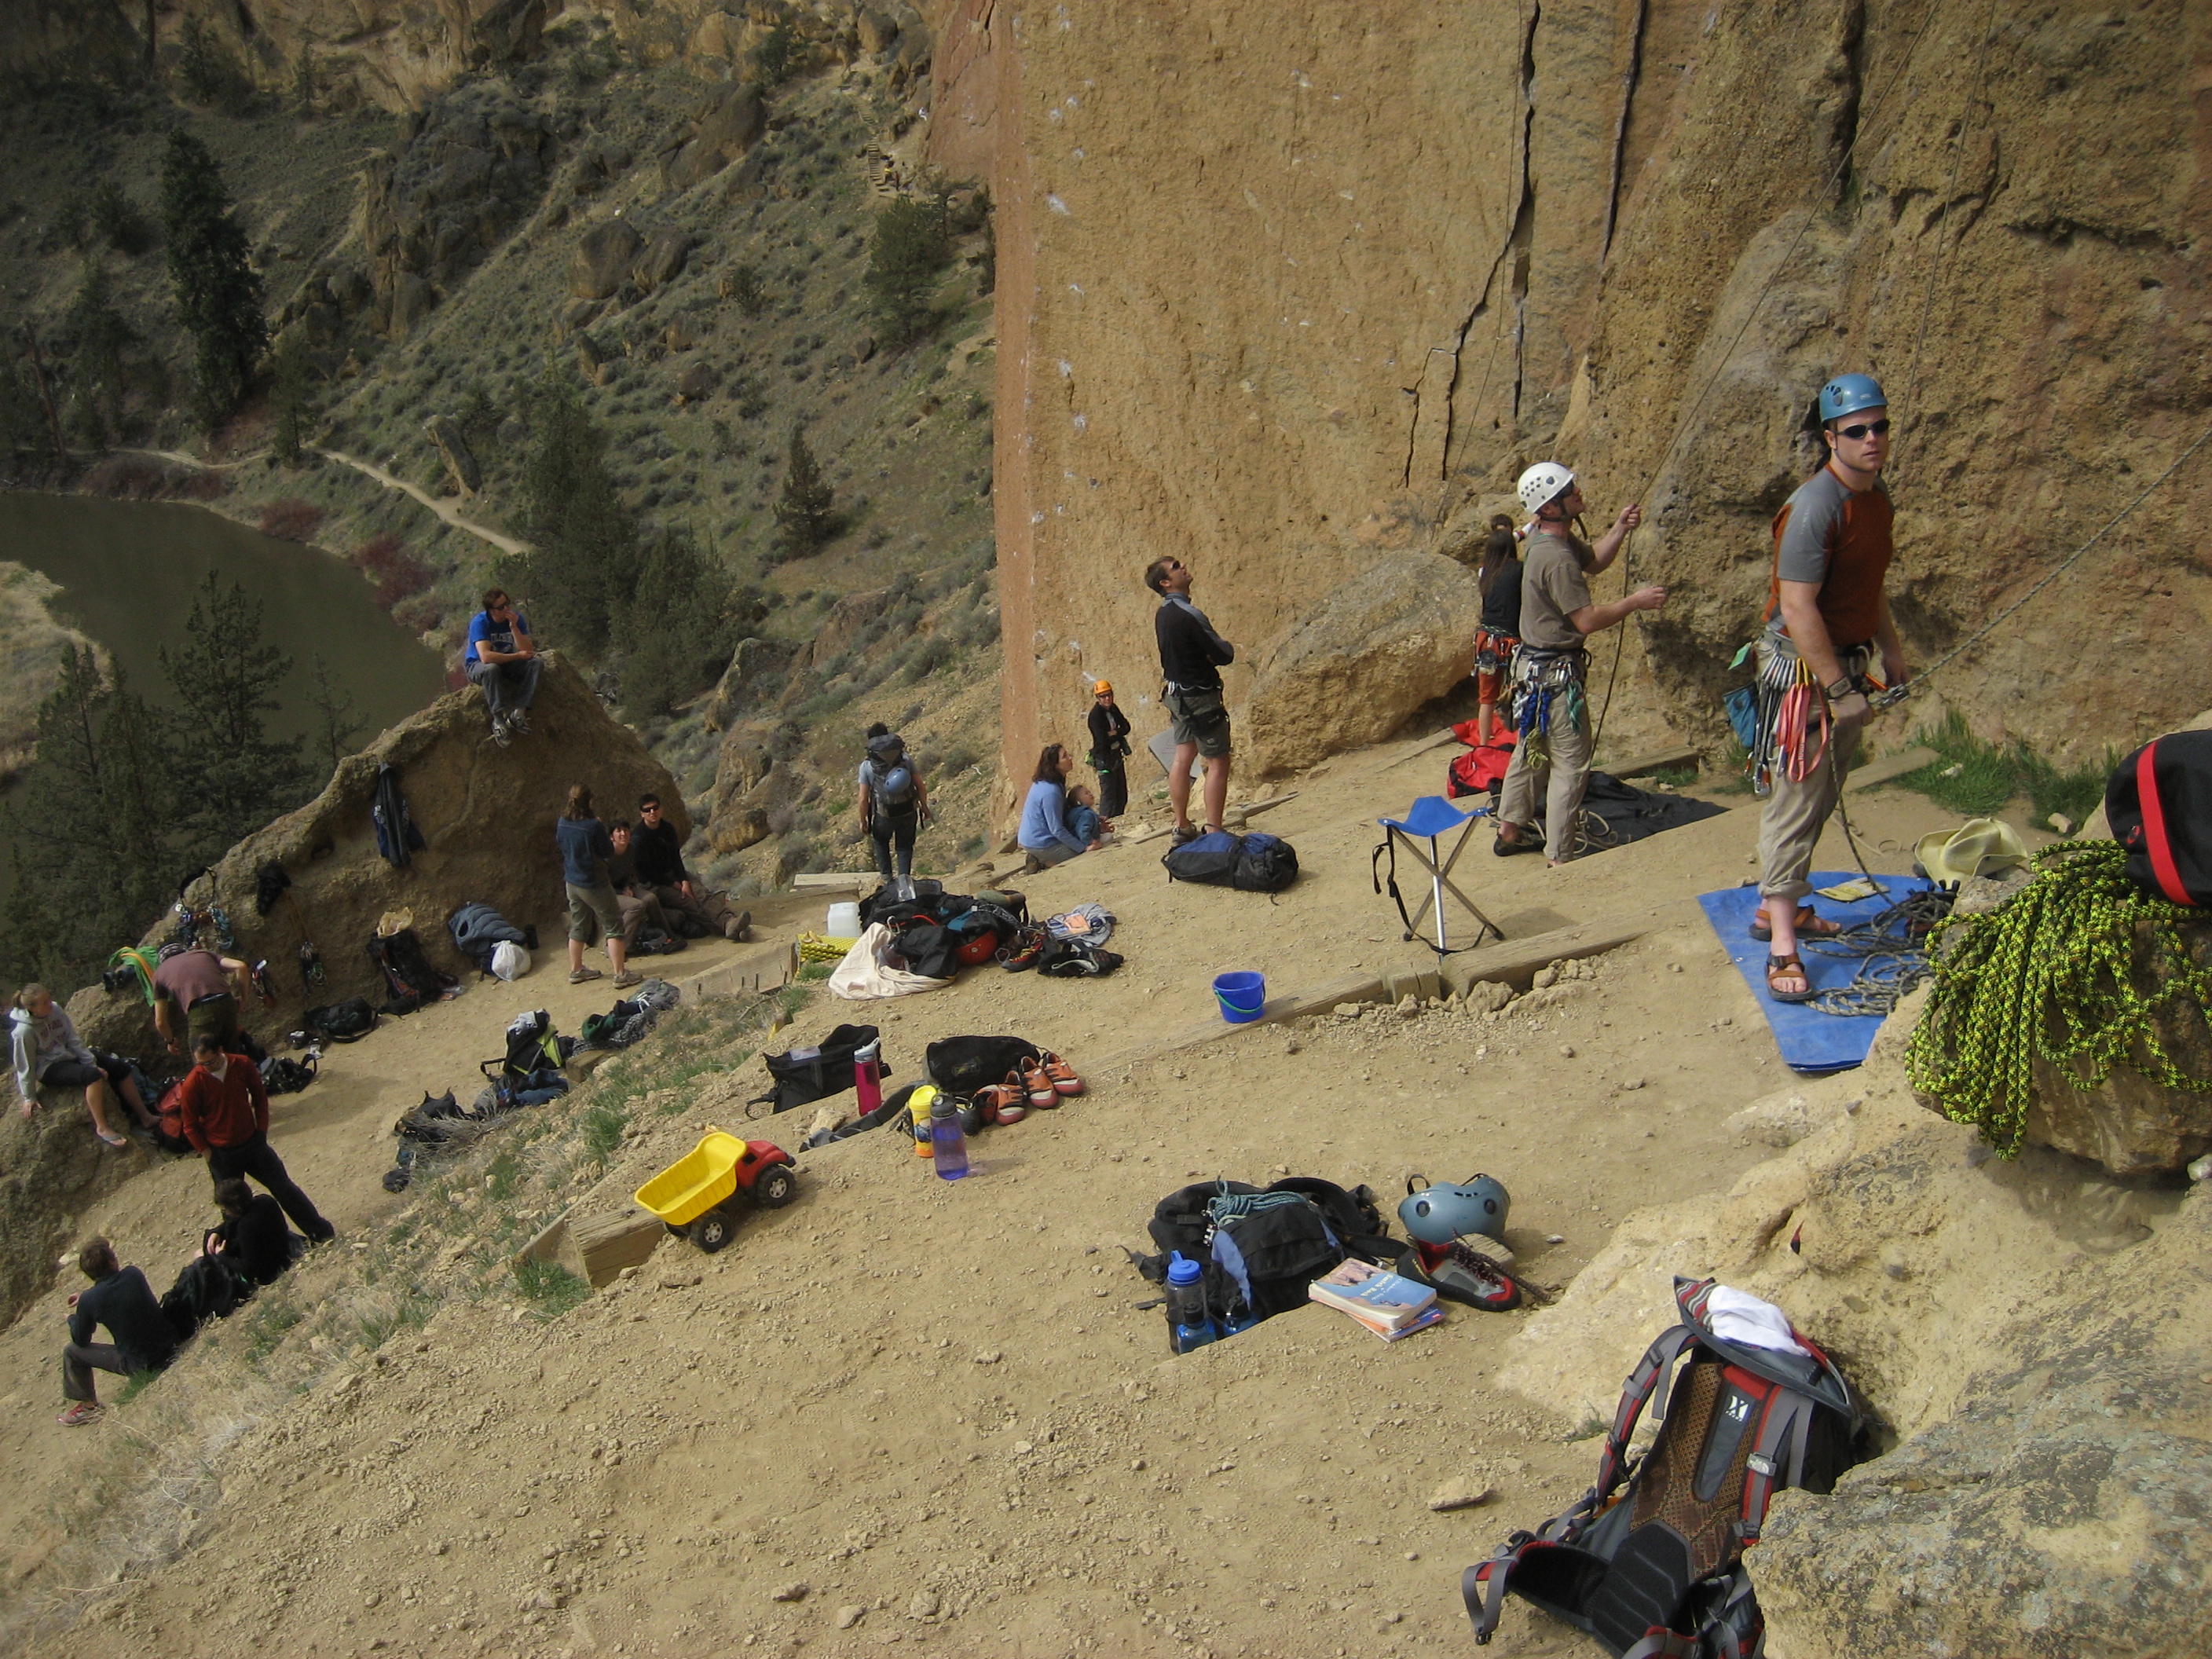
Since this was our first time leading outdoors we decided to start with the easiest routes we could find in the guidebook, and work up gradually. We found some nice beginner routes in the Cinnamon Slab area just before the Dihedrals. Everything went great, and we each had a successful lead behind us well before the mobs of climbers started showing up. We might have stayed more impressed with ourselves if we hadn't seen that the next climbers on our first route were parents setting up ropes for their 5 and 6-year-old children. Look close in the picture and you'll see that just behind Scott's belay stance there are a couple of kid-size shoes, and a tonka trunk. Ah well, a little humility might even be good for us, I suppose.
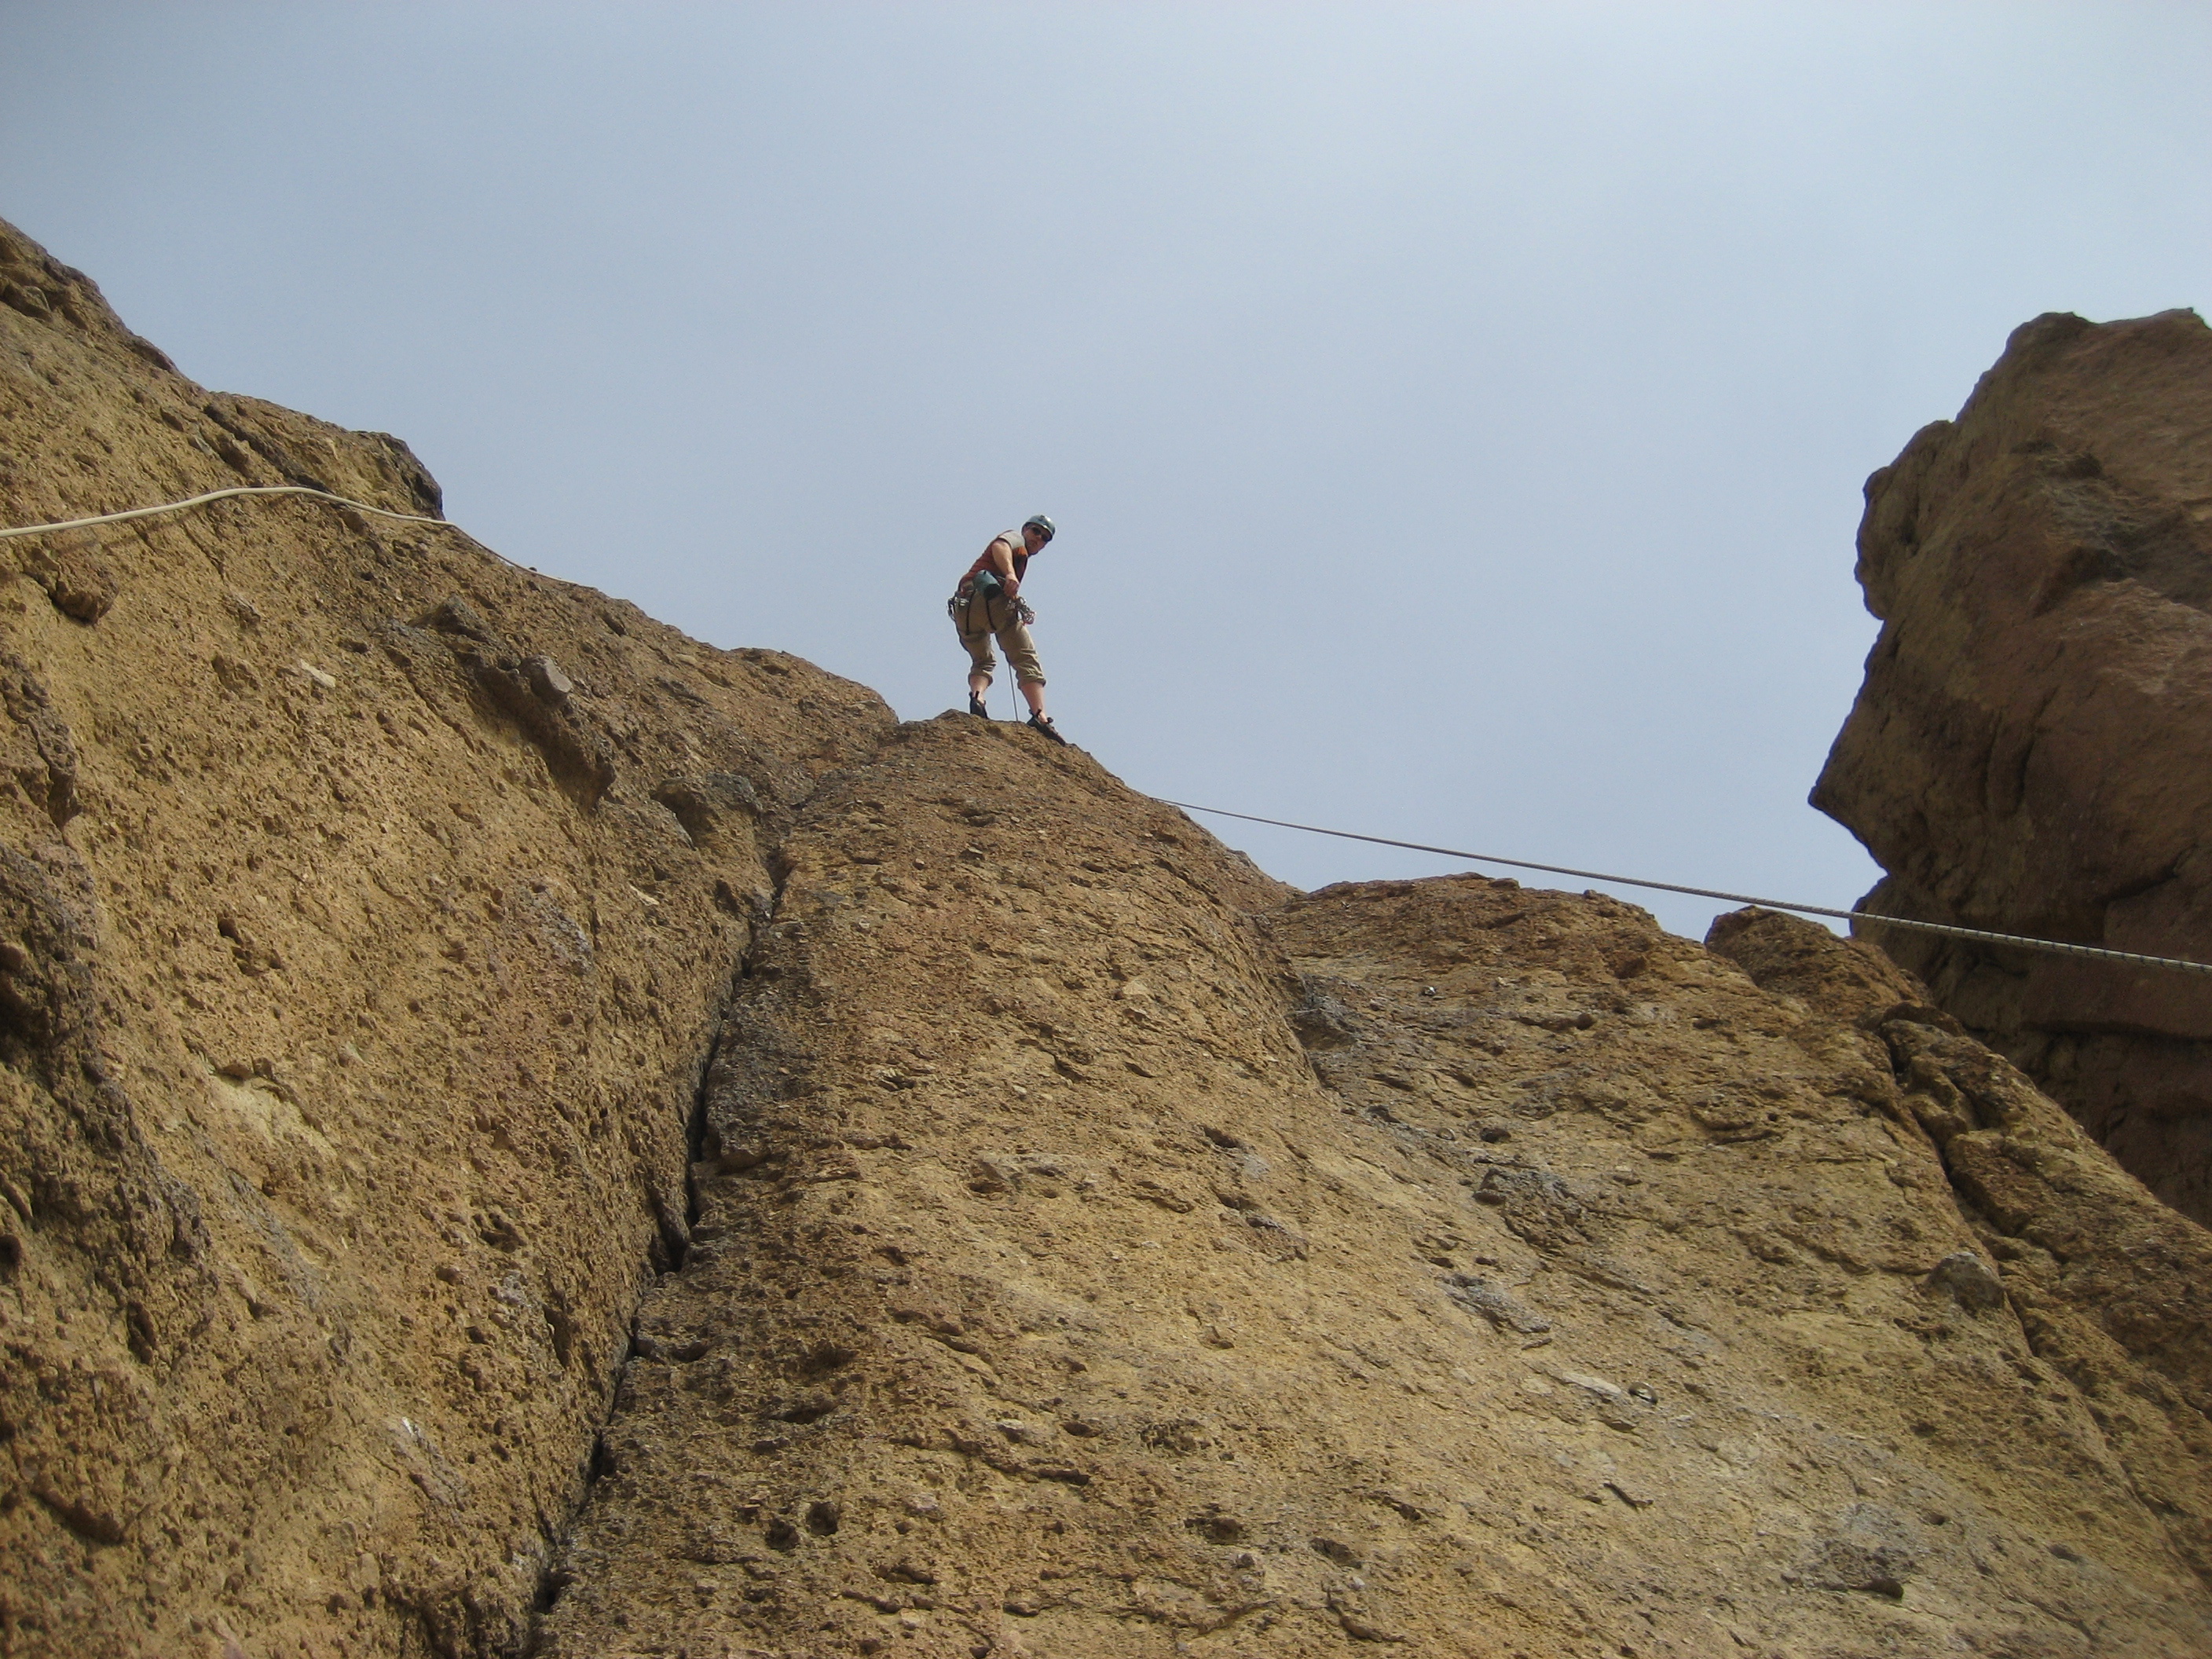
Leading on this rock outdoors was very different from anything we had done in the gym. The most obvious change is that there's not any tape showing exactly where to put your hands and feet. So we all found ourselves shopping around for a while at each stance, always looking to see if we could find better holds.
And for me, at least, the psychological difference between top-rope and lead was much wider outside than in the gym. That might have been because these routes were not very steep, so any lead fall would have certainly meant a fairly quick swing into some very rough rock. I didn't realize how much I was staining, over-gripping, over-thinking and neglecting technique until I got onto toprope of a route I had just finished leading. Suddenly I was relaxed, comfortable, and moving quickly and smoothly on a route that moments before had my leg shaking wildly. So I'll definitely need to improve my ability to relax, use good technique, and just trust myself.

We stepped up the difficulty a bit when we moved over to the "Peanut" and confirmed the rumors that Smith routes have tough starts. On all of our routes in the morning the hardest moves were right at the beginning. We were glad that Scott D. brought his stick clip, (in spite of being afraid he might feel like a goober carrying around such a long pole), so we could get into that first bolt while it was still 15 feet up and have some ropes protection for the first tricky moves. And rather than seeing him as a goober, climbers nearby were grateful that Scott was happy to share his stick with them. Have I mentioned before at how friendly people seem to be in the climbing community? Everyone we met at Smith was very nice, and they didn't even make fun of us even though we were obviously beginners, (our gear was all obviously unused since it was still so shiny).
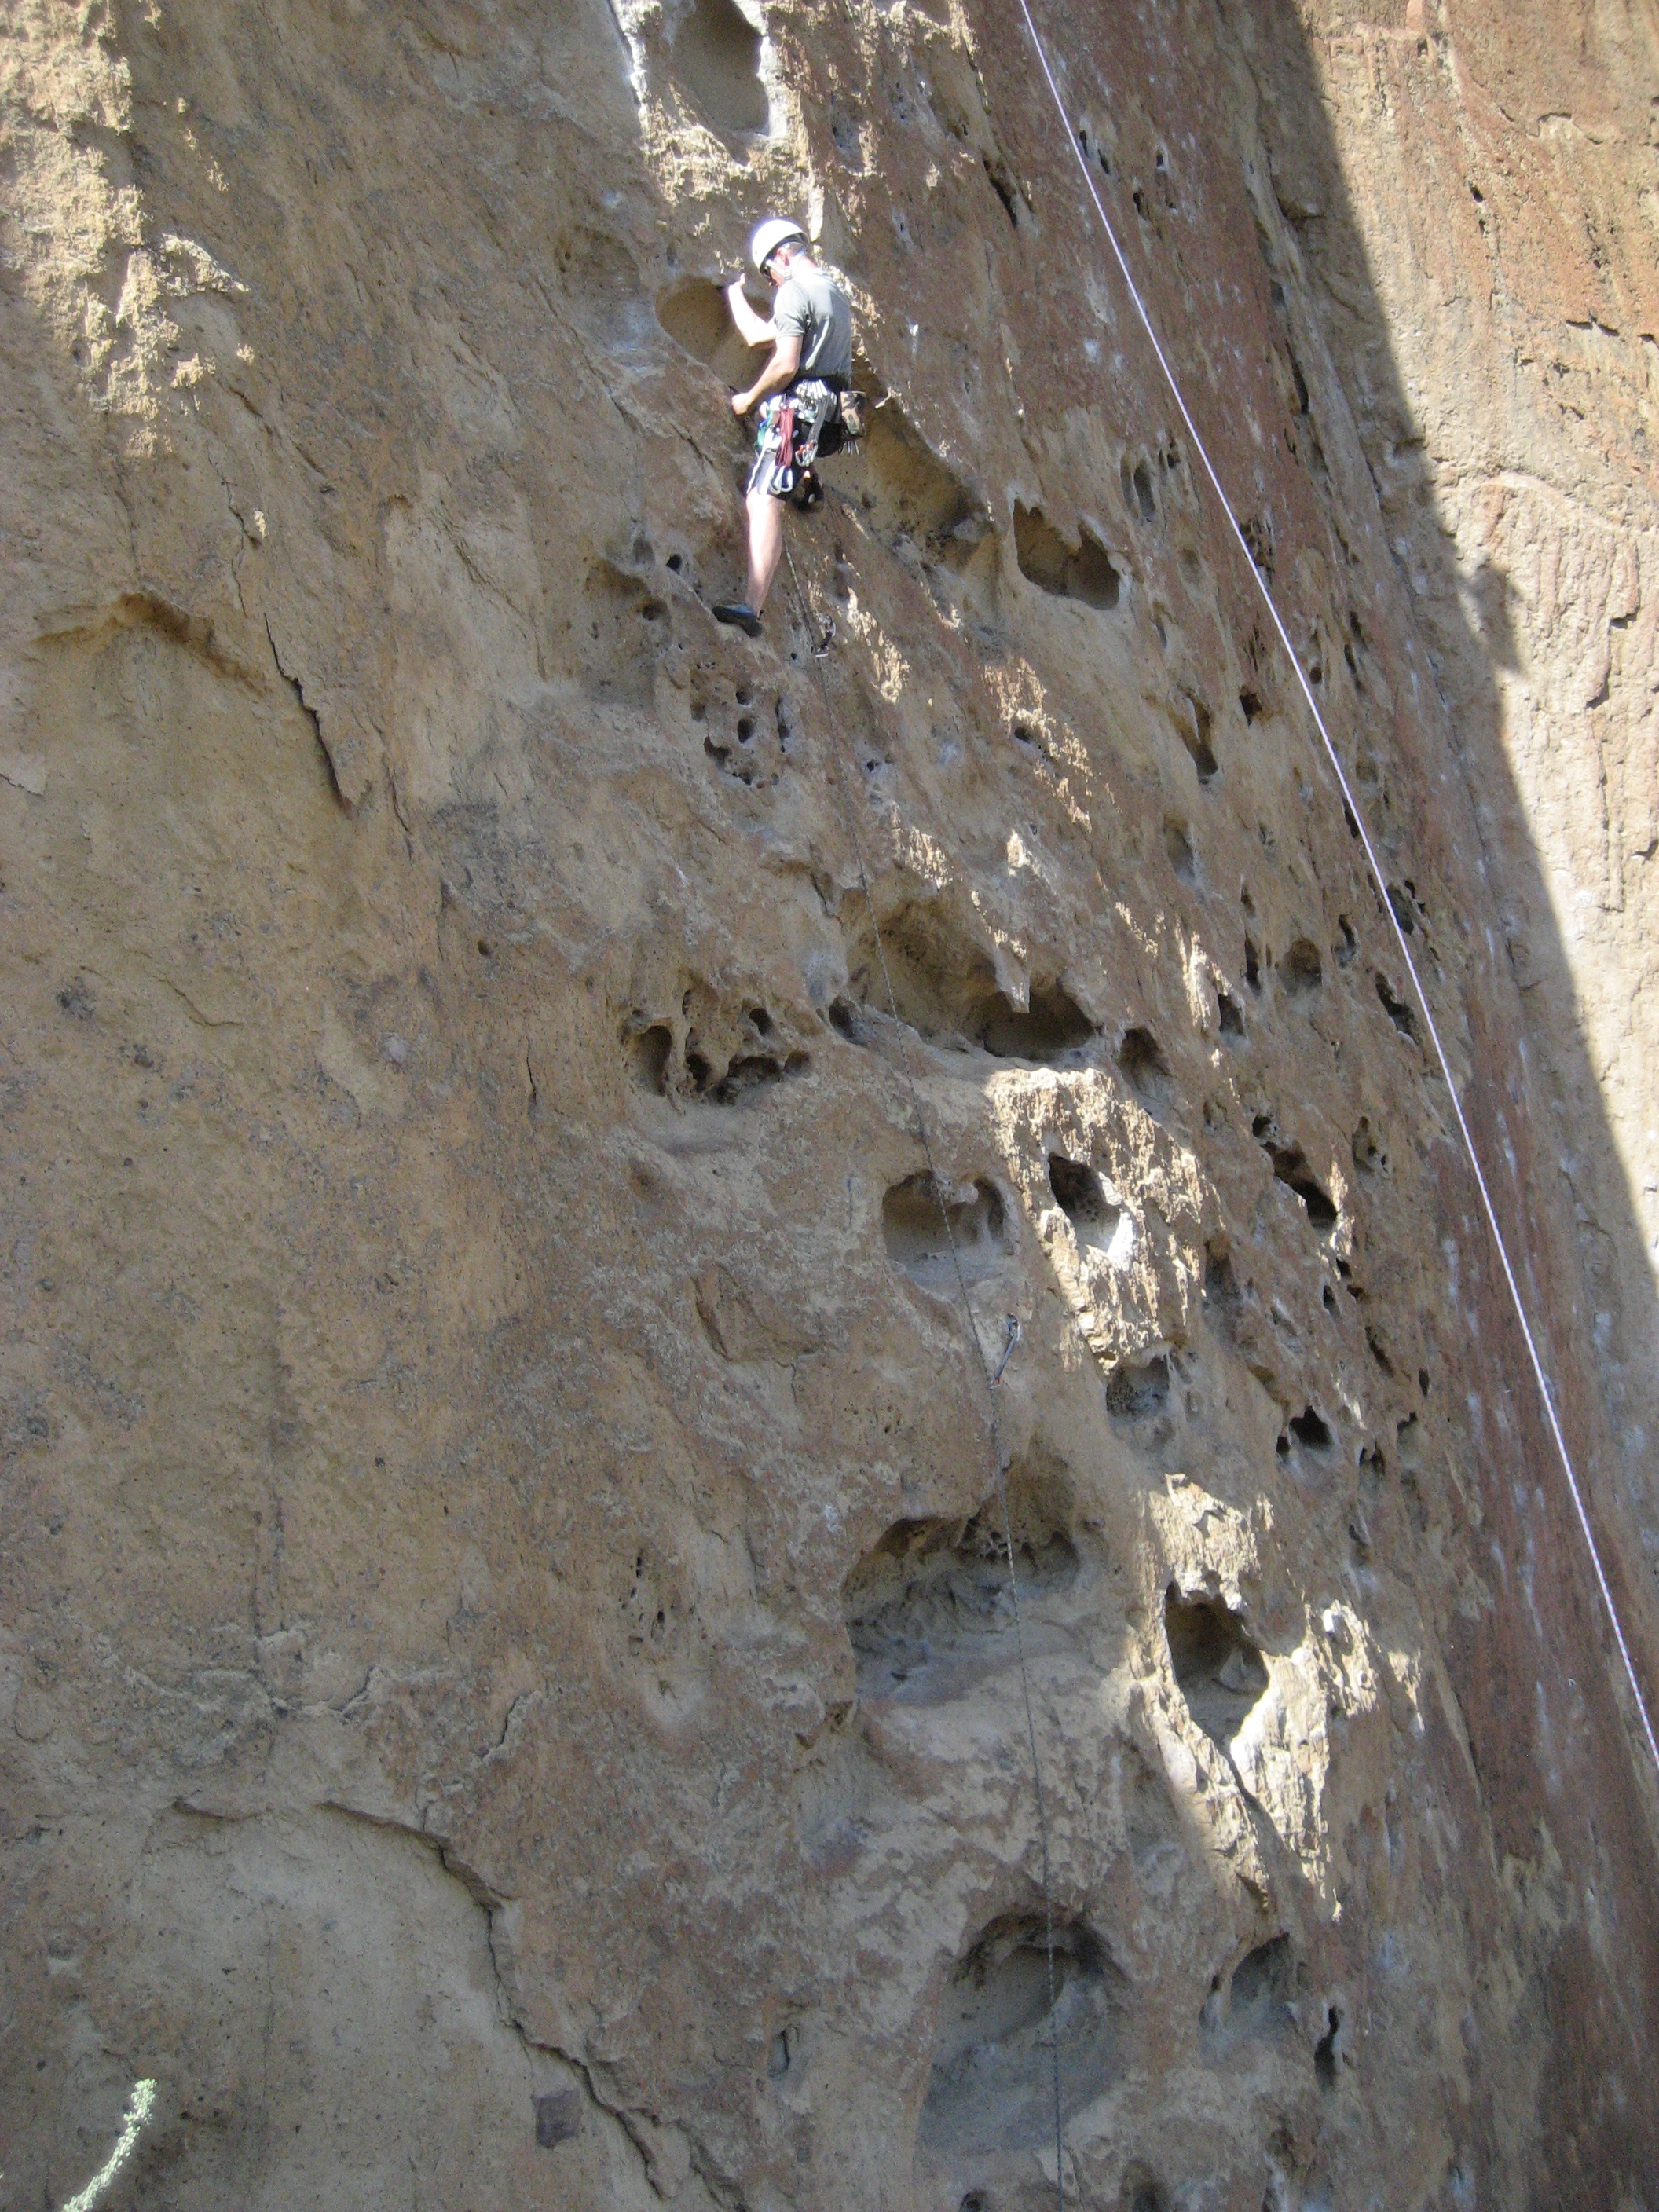
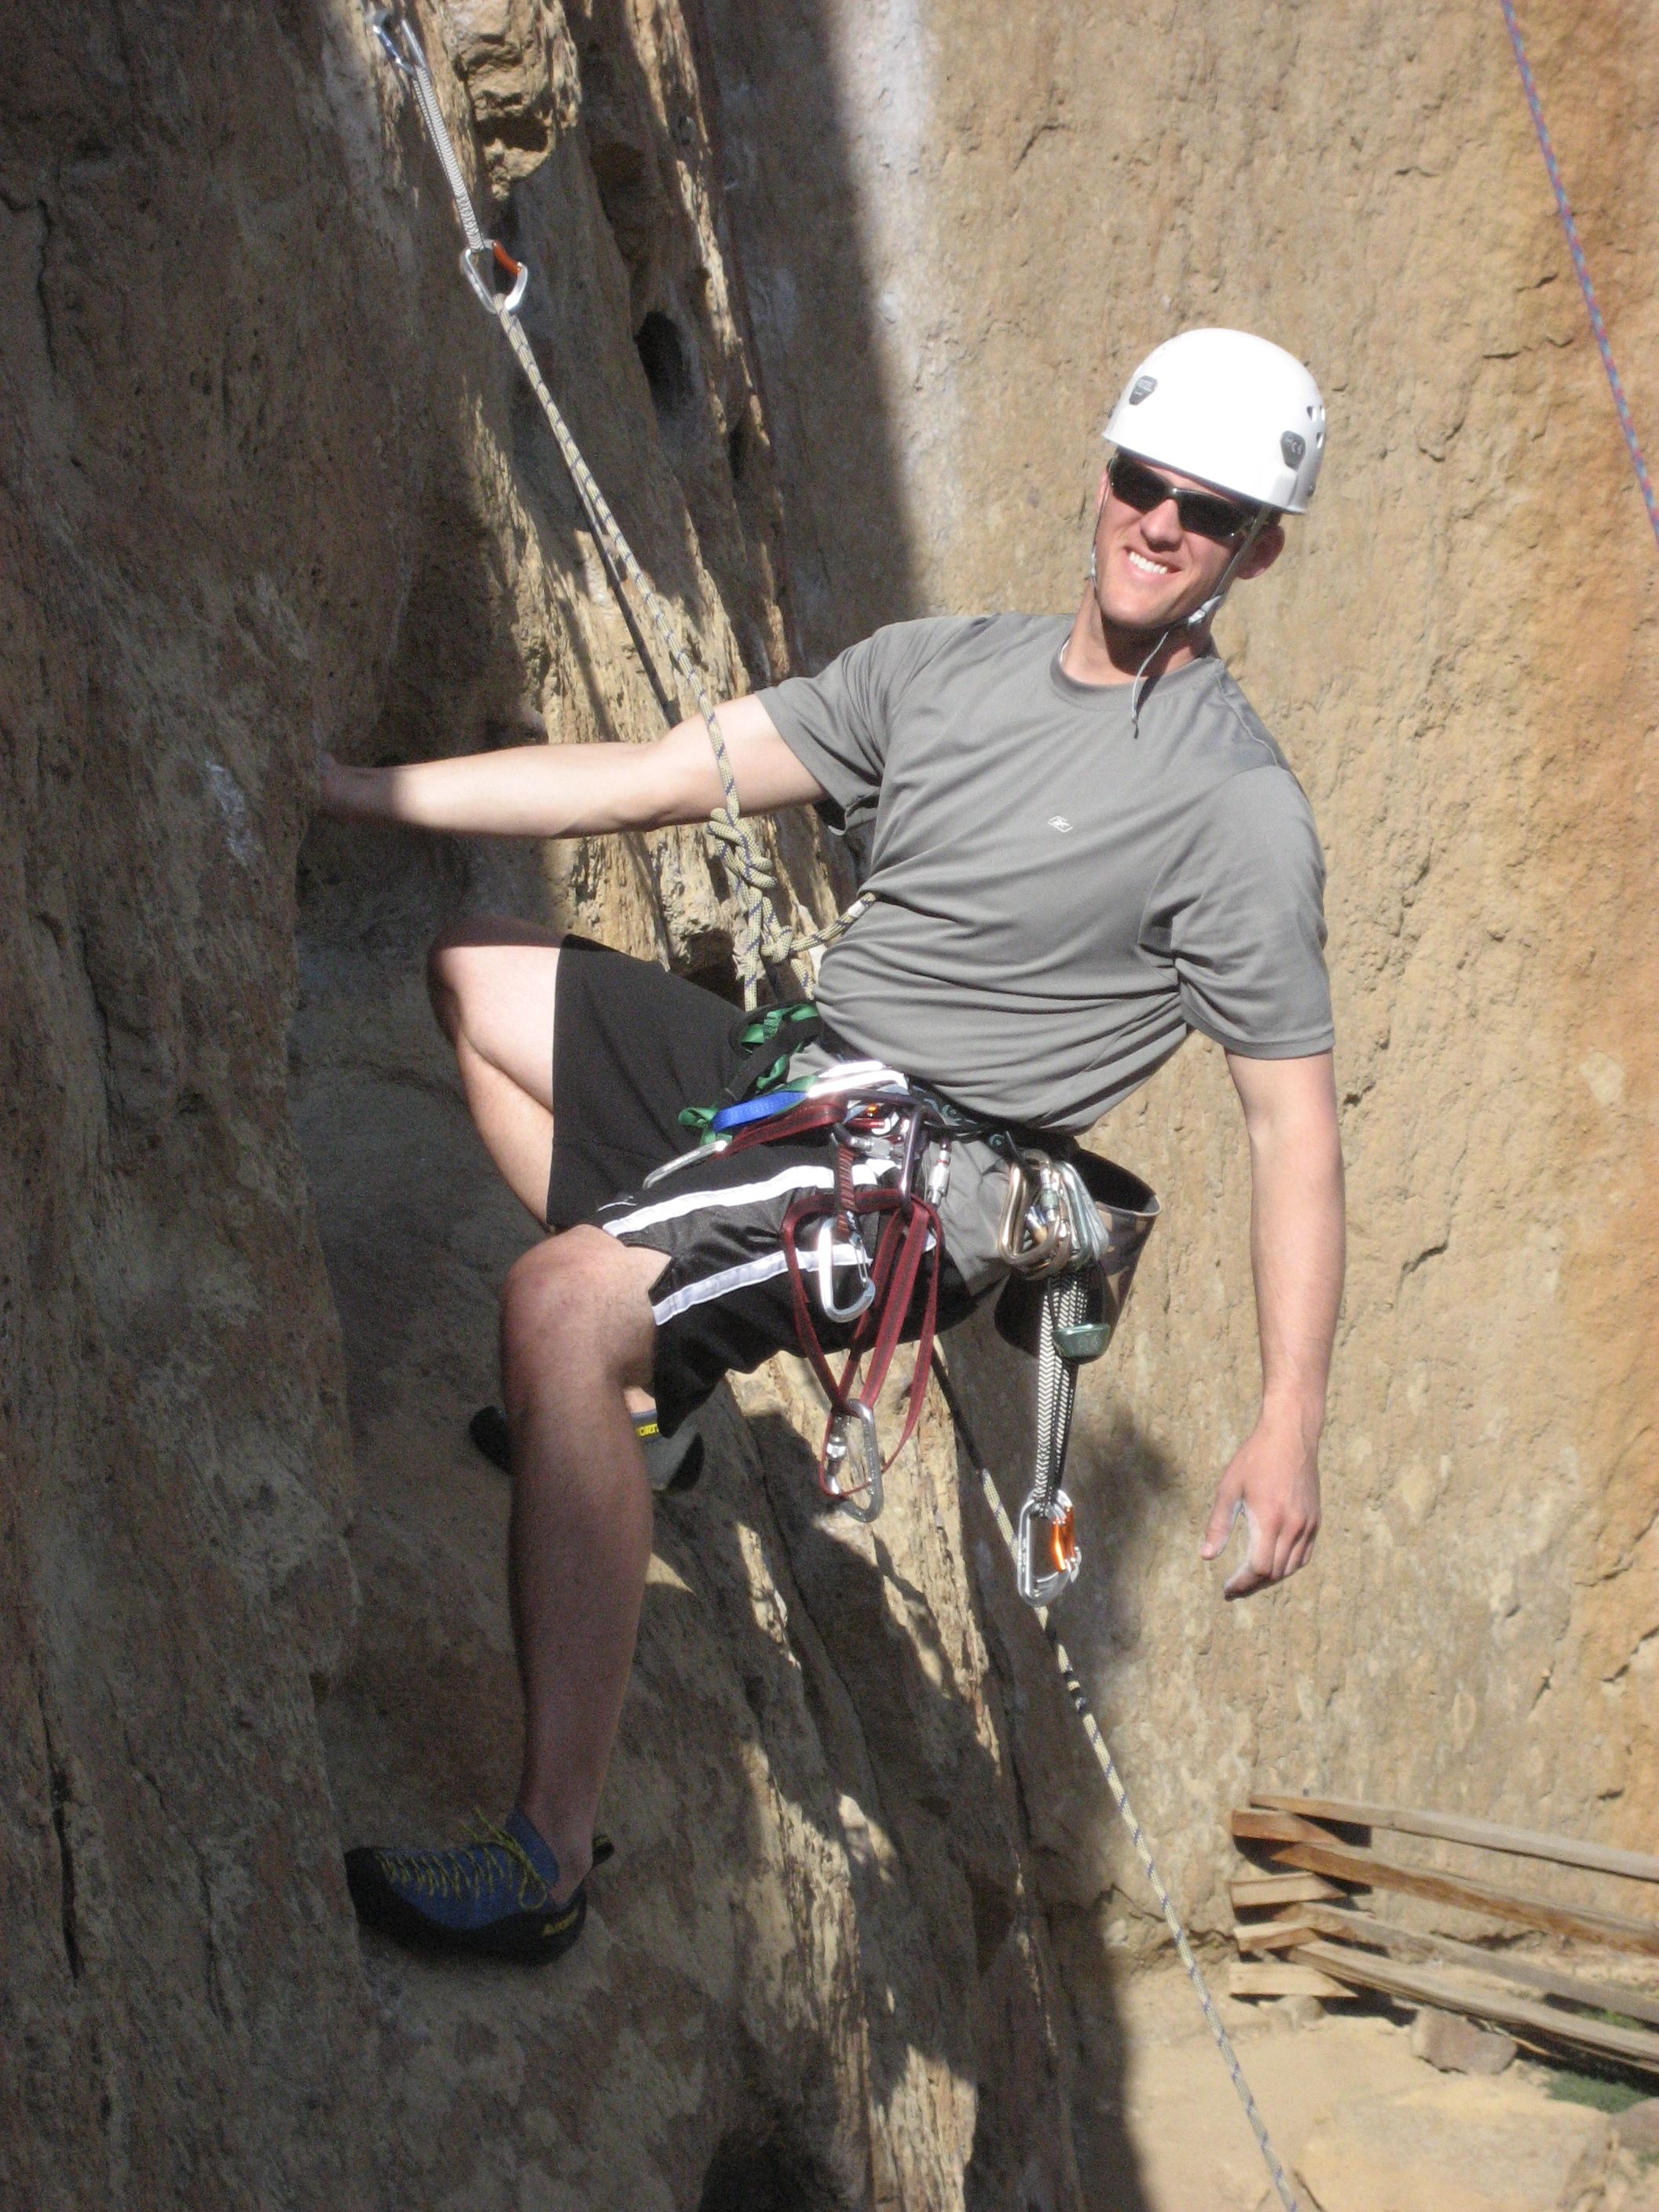
By the afternoon, we were getting a little tired of knobby face climbs on wickedly abrasive rock. We got some variety on the "5 Gallon Buckets" route, a ladder of pockets so big you could sit down inside most of them. Scott DV was anxious to lead this one and found the underclings in the pockets extremely gratifying. Just take at look at how confident he his flashing those pearly whites while on lead.
Here's a run down of the six routes we climbed. All three of us climbed each one of these with (almost) no falls at all.
Night Flight (5.5) Carl, Scott D., and Scott DV. each on lead in turn.
Easy Rider (5.6) Scott D. on lead.
Lichen It (5.8) Carl on lead.
Ginger Snap (5.8) Scott D. on lead.
Hop on Pop (5.8) Carl on lead.
5 gallon buckets (5.8) Scott DV. then Scott D. on lead.
Next time we go we'd like to lead some 5.9 routes, (and maybe bring a friend to put up some rope for us on some 5.10). One thing we didn't find was any terrain steep enough to make us comfortable to take any practice falls. I think Scott D. really missed that---sometimes I almost wonder if falling is his favorite part in this sport.
See the complete set of photos from this trip.
Posted Wed 22 Apr 2009 12:19:40 PM PDTMany readers have heard already, but it will be news to some that I recently changed jobs. After just short of 4 years with Red Hat, I've now taken a job working for Intel, (in its Open-source Technology Center). It was hard to leave Red Hat---I have only fond memories of working there, and I will always be grateful to Red Hat for first helping me launch a career out of working on Free Software.
Fortunately, as far as my free-software work is concerned, much of it will be unaffected by the job change. In fact, since I've been looking at X/2D/Intel driver graphics performance for the last year already, this job change should only help me do much more of that. And as far as cairo goes, I'll continue to maintain it, but I haven't been doing much feature development there lately anyway. Instead, the most important thing I feel I could do for cairo now is to continue to improve X 2D performance. And that's an explicit job requirement in my new position. So I think the job change will be neutral to positive for anyone interested in my free-software efforts.
As my first task at Intel, I took the nice HP 2510p laptop I was given on the first day, (which has i965 graphics of course), installed Linux on it, then compiled everything I needed for doing X development. I would have saved myself some pain if I had used these build instructions. I've since repeated that exercise with the instructions, and they work quite well, (though one can save some work by using distribution-provided development packages for many of the dependencies).
Also, since I want to do development with GEM, I built the drm-gem branches of the mesa, drm, and xf86-video-intel modules. That's as simple as doing "git checkout -b drm-gem origin/drm-gem" after the "git clone" of those three modules, (building the master branch of the xserver module is just fine). That seemed to build and run, so I quickly installed it as the X server I'm running regularly. I figured this would be great motivation for myself to fix any bugs I encountered---since they'd impact everything I tried to do.
Well, it didn't take long to find some performance bugs. Just switching workspaces was a rather slow experience---I could literally watch xchat repaint its window with a slow swipe. (Oddly enough, gnome-terminal and iceweasel could redraw similarly-sized windows much more quickly.) And it didn't take much investigation to find the problem since it was something I had found before, a big, blocking call to i830WaitSync in every composite operation. My old favorite, "x11perf -aa10text" was showing only 13,000 glyphs per second.
I had done some work to alleviate that before, and Dave Airlie had continued that until the call was entirely eliminated at one point. That happened on the old "intel-batchbuffer" branch of the driver. Recall that in January Eric and I had been disappointed to report that even after a recent 2x improvement, the intel-batchbuffer branch was only at 109,000 glyphs per second compared to 186,000 for XAA.
Well, that branch had about a dozen, large, unrelated changes in it, and poor Eric Anholt had been stuck with the job of cleaning them up and landing them independently to the master branch, (while also writing a new memory manager and porting the driver to it).
So here was one piece that just hadn't been finished yet. The driver was still just using a single vertex buffer that it allocates upfront---and a tiny buffer---just big enough for a single rectangle for a single composite operation. And so the driver was waiting for each composite operation to finish before reusing the buffer. And the change to GEM had made this problem even more noticeable. And Eric even had a partially-working patch to fix this---simply allocating a much larger vertex buffer and only doing the sync when wrapping around after filling it up. He had just been too busy with other things to get back to this patch. So this was one of those times when it's great to have a fresh new co-worker appear in the next cubicle asking how he could help. I took tested Eric's patch, broke it up into tiny pieces to test them independently, and Eric quickly found what was needed to fix it, (an explicit flush to avoid the hardware caching vertex-buffer entries that would be filled in on future composite calls).
So, with that in place the only thing left to decide was how large of a vertex buffer to allocate upfront. And that gives me an excuse to put in a performance plot:
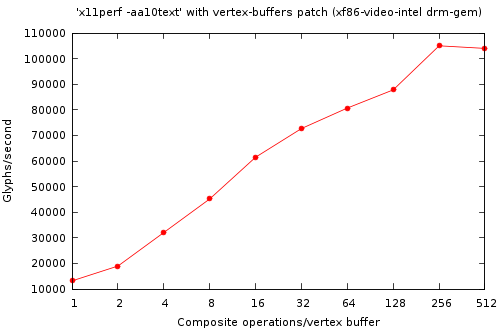
So the more the better, (obviously), until we get to 256 composite operations fitting into a single buffer. Then we start losing performance. So on the drm-gem branch, this takes performance from 13,000 glyphs/second to 100,000 glyphs/second for a 7.7x speedup. That's a nice improvement for a simple patch, even if the overall performance isn't astounding yet. It is at least fast enough that I can now switch workspaces without getting bored.
So I went ahead and applied these patches to the master branch as well. Interestingly, without any of the drm-gem branches, and even with the i830WaitSync call on every composite operation, things were already much better than in the GEM world. I measured 142,000 glyphs/second before my patch, and 208,000 glyphs/second after the patch. So only a 1.5x speedup there, but for the first time ever I'm actually measuring EXA text rendering that's faster than XAA text rendering. Hurrah!
And really, this is still just getting started. The patch I've described here is still just a bandaid. The real fix is to eliminate the upfront allocation and reuse of buffers. Instead, now that we have a real memory manager, (that's the whole point of GEM), we can allocated buffer objects as needed for vertex buffer, (and for surface state objects, etc.). That's the work I'll do next and it should let us finally see some of the benefits of GEM. Or if not, it will point out some of the remaining issues in GEM and we'll fix those right up. Either way, performance should just keep getting better and better.
Stay tuned for more from me, and look forward to faster performance from every Intel graphics driver release.
Posted Tue 15 Jul 2008 03:21:51 PM PDTWith cairo's recent 1.6.4 release, we've hoped to reach the nirvana of applications that display and print documents with perfect fidelity. Unfortunately, reality isn't always as pleasant as we would like. I recently received a bug report that Firefox 3 (using cairo 1.6.4) resulted in a blurry mess when printing a very simple web page, (some text, a table, and an image). Exploring the details of this case reveals at least three independent problems that conspire to give the bad results.
Bug 1: Firefox+cairo uses image fallbacks for table borders
First, here's the simplest web page I was able to construct to show the problem, (nothing more than a single-cell table with a border): bug.html (122 bytes).
Using Firefox3 with cairo 1.6.4 on a Fedora9 system, I did a "print to file" and obtained the following PDF output: bug.pdf (14,465 bytes).
This output is still quite accurate and fairly usable. But we've already seen problem #1. Note that the file size has increased by a factor of 100 compared to the original HTML. The PDF does have more content, (firefox adds a header and footer for example), but nothing that explains such a large file. Instead, something about the way that firefox is expressing the table border is resulting in cairo putting fallback images into the resulting PDF file. So that's the first bug. I'll look closer at this, (probably with libcairowrap), and make a bug report to the mozilla folks if necessary.
Also, note that when cairo puts the fallback images into the PDF file it uses a "knockout group" to do so. This is a particular PDF construct that I'll discuss later.
Bug 2: Poppler+cairo expands knockout groups to full-page fallbacks
Next, we can use the poppler library, (with evince or a pdf2ps utility), to read the PDF file and use cairo to generate a PostScript file: bug.ps (138,067 bytes).
Notice that there has been another factor of 10 increase in the file size. Here, poppler has convinced cairo to generate a full-page fallback image rather than just the minimal fallback images present in the PDF file. This is due to the way poppler is handling the knockout group and really comes down to the difficulty of getting a single, desired result to pass through two systems with very different rendering models.
To explain a bit, (but ignoring many gory details), a PDF knockout
group can be a very complicated thing, so poppler has some fairly
sophisticated code to handle these. This support involves rendering
everything in the group twice and then using cairo's DEST_OUT and ADD
compositing operators to properly combine them. Well, PostScript can't
do fancy compositing like DEST_OUT and ADD, so of course cairo falls
back to image-based rendering for things. The irony here is that the
only reason cairo is using a knockout group in the original PDF file
is to prevent any compositing from happening, (the fallback image
needs to replace any "native" content that might appear below it). And
it turns out that painting an image without any compositing is the
only kind of image painting that PostScript knows how to do.
So, cairo is using an advanced feature of PDF to describe precisely the semantic that PostScript supports natively. The change we need is to fix poppler to recognize this case and ask for the simple thing from cairo's PostScript backend so that we don't get this full-page fallback explosion.
Bug 3: Cairo uses the wrong resolution for fallback images (in groups)
If it were only for those first two bugs, the intermediate file sizes would have been larger than normal, but the final result would have looked great and printed just fine. And in that case, I probably would have never even received a bug report.
But there's a third problem that is the most pernicious, because it results in the final result looking just awful. When cairo inserts the full-page fallback into the final PostScript file, it is inserting it at 300dpi, but it does that only after rendering it to an intermediate 72dpi image, which is then scaled up. That's why the final PostScript file appears so blurry and hard to read.
This third problem is the first I attempted to fix, (since it involves cairo alone), and I described my attempts in several posts to the cairo mailing list over the past couple of days, beginning here:
Bug with fallback resolution of groups
In that series of posts I coded a minimal test case in cairo's test suite for the resolution problem, and a patch that fixes that test case. But when I use a patched cairo for the PDF to PostScript conversion of the file described here, I end up with the following result: bug-patched-cairo.ps.
Here, there's still a giant, full-page fallback image, (this is expected since I haven't touched poppler yet). And the image is at least rendered at the correct resolution this time, (notice that the text that appears is much more sharp than in the previous PostScript file). However, the original HTML table is now entirely missing. So there's definitely something wrong with my patch.
I'll continue to chase these bugs down. The interesting thing about this chain is that it's only as strong as its weakest link. Fixing any of the individual problems here will make the end-to-end behavior be quite acceptable.
And I'll continue my quest to get high-quality display and print output from cairo-using applications. It can be a challenging goal, but it's also a lot of fun and very rewarding. Please feel free to jump in and help if you're interested.
Posted Thu 22 May 2008 12:00:55 PM PDTI have the opportunity to be attending a GTK+ Hackfest in Berlin this week. Visiting Berlin, (and sleeping about a block away from Checkpoint Charlie), is quite interesting, and a welcome new experience for me.
I promised some people back home that I would post daily updates on things that get discussed/decided here. The hackfest could only support a couple dozen people, but certainly there's a larger audience interested in the things happening here. And it would be a shame to not share things with that larger audience.
So far I've done a very poor job of actually getting those updates out. One snag was that due to some interaction of bugs in ikiwiki and/or planet, planet.gnome.org decided to post ancient posts of mine instead of recent ones. I still haven't worked out those bugs completely. In the meantime, I'm glad that some people that missed it the first time enjoyed my writeup on learning git. And for anyone wondering about my son Scott, it's been over 6 months since his first steps, and he's now walking, running, and doing everything else expected of a 2-year-old. Anyone who met him for the first time now would never know that he ever had any problem. So that's wonderful.
But getting back to the hackfest: Due to my travel schedule I missed the first day completely. I know that some transitioning-to-GTK+-3.0 plans were discussed then, and hopefully people have seen those slides. There was also a lot of talk about adding introspection to GTK+, (to enable automatic language bindings and other fancy things). The introspection discussion has continued over the second and third days, and hopefully it's going just great, (but I haven't been a part of it at all---somehow it's just one of those topics that makes my brain switch off---but I'm glad other people are interested in solving the issues).
So what I did do on Tuesday included a fantastic presentation from Behdad Esfahbod about the proposed "user font" API for cairo. This is something that's had some preliminary patches since 2006 when Kristian Høgsberg first needed this for supporting fonts embedded in PDF files. The discussion here took great advantage of having all the right people together at the same time, (though it would have been great to have Kristian here as well). We had an implementor (Behdad), a maintainer (myself), and two consumers of the API, (Benjamin "Company" Otte of swfdec fame and Alp Toker of WebKit/GTK+. That was a great group to have together to make sure we the API would make everybody happy. We found several changes that will improve the API quite a bit, but also shouldn't be too much work. Behdad plans to have the changes all committed to cairo, (on a new 1.7 development branch), before the end of the week.
Afterwards, Behdad returned my code-review favor by taking a look at the patch series I have for adding support for arbitrary true-color visuals to cairo. This series is to address a number of fatal bugs that occur when targeting X servers that don't have the Render extension, (Xvnc is a common case). I knew my patch series had some ugly bits in it, but I wasn't sure what the cleanest fix would be. Behdad set me straight right away. So I'll be landing this in cairo very shortly, and this is one of the very last issues left unfinished on the cairo 1.6 roadmap.
The only other unfinished feature on the roadmap is support for pseudo-color visuals, but Behdad is trying to convince me to let that slip, (it's a lot of work for fairly small gain). Who would be really hurt to see this feature slip again? Let me know if you are, (and I'll let you know how you can help make it happen too).
Posted Thu 13 Mar 2008 04:53:20 PM PDTI'm definitely overdue as far as posting an update on the progress of the work we've been doing to improve EXA performance for the i965 driver. And just yesterday, Benjamin Otte pointed out to me that it's really hard for many people to get any understanding at all about some of the work that's going on within the X.org development community.
Part of my reply to Benjamin was that there were a lot of excellent talks given at LCA this year, (Keith Packard, Dave Airlie, Adam Jackson, Jesse Barnes, Peter Hutterer, Eric Anholt, and myself were all there talking about X in one way or another). And that is true, but it's also true that many people were not able to attend LCA to hear those talks. And while the LCA conference kindly posts video of the talks that's not always the most desirable way of getting information when not at the conference in person.
So I think it would be fair to say that we've been doing a poor job of providing easy-to-find information about what's going on with X. I definitely want to help improve that, and I even just got an official designation to do exactly that. I was recently elected to the X.org Board of Directors and also assigned to chair a Communications committee whose job it is to help X.org communicate more effectively. What can we do better? Please email me with your ideas.
In the meantime, for my own part, I've just done a fairly thorough writeup of my LCA talk. That's something I've been wanting to get in the habit of doing for a while. One thing I can't stand is reading presentation slides that are almost content free---where clearly they weren't meant to stand alone but were meant to be accompanied by someone speaking for up to an hour. And I know I've been guilty of posting slides like that before. So this time, I've written some text that should stand alone quite well, (though, since I just wrote it today it might not correlate extremely well with what I said that day at LCA---but I've tried to address the same themes at least).
Posted Wed 12 Mar 2008 09:33:26 AM PDTAs readers of my blog know, I've been working on improving the Intel 965 driver within the EXA acceleration architecture of the X server. Meanwhile, there's an alternate acceleration architecture originally announced by Zack Rusin in August 2006 called Glucose. The idea with Glucose is to accelerate X rendering operations by using OpenGL.
Recently there's been a fair amount of activity in the various Glucose branches, so I thought I'd take a look to see how well it's working. This was quite convenient for me as the current Glucose work is focused only on Intel cards. Since Glucose isn't quite ready for prime-time yet, it does require fetching various non-master branches of several git repositories. It's not always obvious which branches to take, so José Fonseca was kind enough to writeup some Glucose build instructions.
I've followed those instructions and run a benchmark comparing Glucose and EXA. The benchmark I chose is the expedite application that comes with evas, (thanks to the people that kindly pointed out this newer benchmark to me after my recent explorations with the older evas benchmarks). To get expedite you'll need the e17/libs/evas and e17/apps/expedite modules from enlightenment CVS.
Expedite is a nice benchmark in that it separates things like image blending and text rendering into separate tests, (unlike the older evas benchmark). It's also nice that evas includes many backends which can be interesting for comparison. But I won't be looking at anything but its XRender-based backends here---and it looks like evas' cairo and OpenGL backends are not currently functional. They are disabled by default, and when I enabled them I ran into compilation problems, (I suspect neglect and bit rot).
So here are the results I got for three acceleration architectures:
XAA with the XAANoOffscreenPixmaps option, (this is an all-software implementation for reference).
Glucose---the new thing we're looking at here.
EXA, (as available in the various glucose branches---so without things like my recent glyph-pixmaps work).
The results are all normalized to the performance of our baseline, XAA. And larger numbers are better.
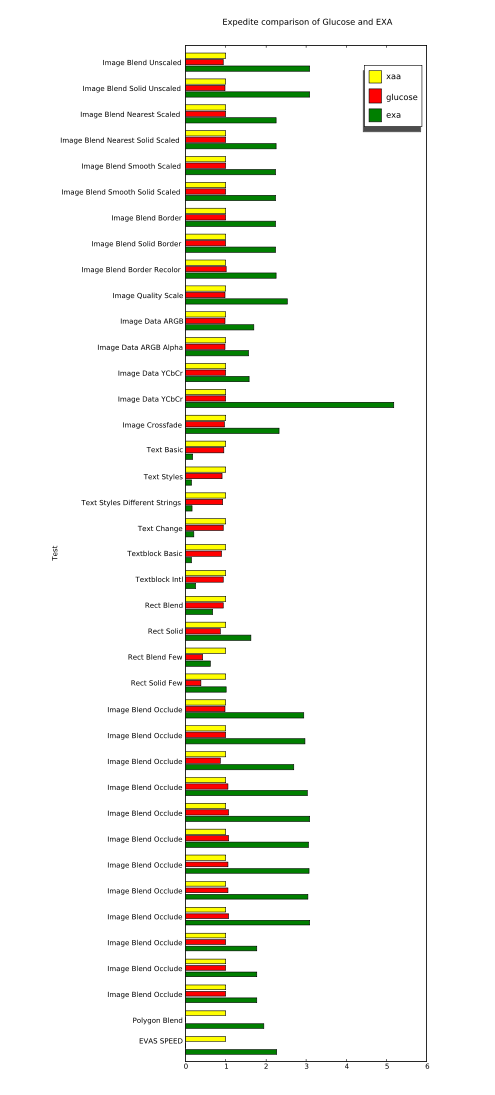
The raw data is also available for anyone with particular interest, (it has non-normalized values as well as results from evas' software backends using both SDL and X11 for image transport).
The quick conclusion is that, so far, I'm not getting any benefit from running Glucose as compared to just running an all-software implementation, (see how all Glucose and XAA bars are basically identical). I might still not have everything compiled or running correctly yet, but I'm quite sure that at least some Glucose code was active during my Glucose run. That's because a glucose module failed to find a required symbol and crashed during the "Polygon Blend" test, (which is why it doesn't have a bar in the chart, nor is there a number for the overall "EVAS SPEED" result for Glucose).
Meanwhile, it's also clear that EXA is going far too slow for text operations. This isn't any surprise since I've documented problems with slow text rendering on the i965 several times before. However, I've never before measured text rendering that's quite this slow. I'm seeing speeds of only about 30k glyphs/sec. with EXA on these branches, while my previous testing always showed about 100k glyphs/sec. I suspect that there's been some regression somewhere in the X server or the Intel driver, (and likely unrelated to anything about Glucose---Keith has reported similar slowness with builds from the master branches).
Another interesting thing to look at is the difference caused by the "few" variants of the "Rect Blend" and "Rect Solid" tests. When going from the non-few to the "few" variants, both Glucose and EXA slow down significantly. I'm quite happy to see these tests in this benchmark since it is often the setup overhead that kills you when trying to accelerate a small number of operations, (and applications have a tendency to want to do that very often). Many synthetic benchmarks are extremely non-useful in hiding this overhead by doing huge batches of operations.
Meanwhile, I'm still working on fixing the horribly slow compositing problems in the i965 driver that are keeping text so slow. Keith Packard and Eric Anholt are helping me debug my code, and hopefully we'll soon have something to show which runs at a reasonable speed.
Posted Fri 19 Oct 2007 02:47:53 PM PDT