
Trying to get a handle on 2D graphics rendering performance can be a difficult task. Obviously, people care about the performance of their 2D applications. Nobody wants to wait for a web browser to scroll past tacky banner ads or for an email client to render a screen full of spam. And it's easy for users to notice "my programs aren't rendering as fast with the latest drivers". But what developers need is a way to quantify exactly what that means, in order to track improvements and avoid regressions. And that measurement is the hard part. Or at least it always has been hard, until Chris Wilson's recent cairo-perf-trace.
Previous attempts at 2D benchmarking
Various attempts at 2D-rendering benchmark suites have appeared and even become popular. Notable examples are x11perf and gtkperf. My claim is that these tools range from useless to actively harmful when the task is understanding performance of real applications.
These traditional benchmarks suites are collections of synthetic micro-benchmarks. Within a given benchmark, some tiny operation, (such as "render a line of text" or "draw a radio box"), is performed hundreds of times in a tight loop and the total time is measured. The hope is that these operations will simulate the workload of actual applications.
Unfortunately, the workload of things like x11perf and gtkperf rarely come close to simulating practical workloads. In the worst case, the operation being tested might never be used at all in modern applications, (notice that x11perf tests things like stippled fills and wide ellipses which are obsolete graphics operations). Similarly, even if the operation is used, (such as a GTK+ radio button), it might not represent a significant fraction of time spent rendering by the application, (which might spend most of its time drawing its primary display area rather than any stock widget).
So that's just the well-known idea to not focus on the performance of things other than the primary bottlenecks. But even when we have identified a bottleneck in an application, x11perf can still be the wrong answer for measurement. For example, "text rendering" is a common bottleneck for 2D applications. However, a test like "x11perf aa10text" which seems like a tempting way to measure text performance is far from ideal. This benchmark draws a small number of glyphs from a single font at a single size over and over. Meanwhile, a real application will use many glyphs from many fonts at many sizes. With layers and layers of caches throughout the graphics stack, it's really not possible to accurately simulate what "text rendering" means for a real application without actually just running the actual application.
And yes, I myself have used and perhaps indirectly advocated for using things like x11perf in the past. I won't recommend it again in the future. See below for what I suggest instead.
What do the 3D folks do?
For 3D performance, everybody knows this lesson already. Nobody measures the performance of "draw the same triangles over and over". And if someone does, (by seriously quoting glxgear fps numbers, for example), then everybody gets a good laugh. In fact, the phrase "glxgears is not a benchmark" is a catchphrase among 3D developers. Instead, 3D measurement is made with "benchmark modes" in the 3D applications that people actually care about, (which as far as I can tell is just games for some reason). In the benchmark mode, a sample session of recorded input is replayed as quickly as possible and a performance measurement is reported.
As a rule, our 2D applications don't have similar benchmark modes. (There are some exceptions such as the trender utility for mozilla and special command-line options for the swfdec player.) And coding up application-specific benchmarking code for every interesting application isn't something that anyone is signing up to do right now.
Introducing cairo-perf-trace
Over the past year or so, Chris "ickle" Wilson has been putting a lot of work into a debugging utility known as cairo-trace, (inspired by work on an earlier tool known as libcairowrap by Benjamin Otte and Jeff Muizelaar). The cairo-trace utility produces a trace of all cairo-based rendering operations made by an application. The trace is complete and accurate enough to allow all operations to be replayed with a separate tool.
The cairo-trace utility has long proven invaluable as a way to capture otherwise hard-to-reproduce test cases. People with complex applications that exhibit cairo bugs can generate a cairo-trace and often easily trim it down to a minimal test case. Then after submitting this trace, a developer can replicate this bug without needing to have a copy of the complex application nor its state.
More recently, Chris wrote a new "cairo-trace --profile" mode and a tool named cairo-perf-trace for replaying traces for benchmarking purposes. These tools are currently available by obtaining the cairo source code, (either from git or in the 1.9.2 development snapshot or eventually the 1.10 release or later). Hopefully we'll see them get packaged up so they're easier to use soon.
With cairo-perf-trace, it's a simple matter to get rendering performance measurements of real applications without having to do any modification of the application itself. And you can collect a trace based on exactly the workload you want, (as long as the application you are interested in performs its rendering with cairo). Simply run:
cairo-trace --profile some-application
Which will generate a compressed file named something like some-application.$pid.lzma. To later benchmark this trace, first uncompress it:
lzma -cd some-application.$pid.lzma > some-application.trace
And then run cairo-perf-trace on the trace file:
cairo-perf-trace some-application.trace
The cairo-perf-trace utility will replay several iterations of the trace, (waiting for the standard deviation among reported times to drop below a threshold), and will report timing results for both the "image" backend (cairo's software backend) and whatever native backend is compiled into cairo, (xlib, quartz, win32, etc.). So one immediately useful result is its obvious to see if the native backend is slower than the all-software backend. Then, after making changes to the graphics stack, subsequent runs can be compared to ensure regressions are avoided and performance improvements actually help.
Finally, Chris has also established a cairo-traces git repository which collects useful traces that can be shared and compared. It already contains several different browsing sessions with firefox, swfdec traces (one with youtube), and traces of poppler, gnome-terminal, and evolution. Obviously, anyone should feel free to generate and propose new traces to contribute.
Putting cairo-perf-trace to use
In the few days that cairo-perf-traces has existed, we're already seeing great results from it. When Kristian Høgsberg recently proposed a memory-saving patch for the Intel driver, Chris Wilson followed up with a cairo-perf-trace report showing that the memory-saving had no negative impact on a traced firefox session, which addressed the concern that Eric had about the patch.
As another example, we've known that there's been a performance regression in UXA (compared to EXA) for trapezoid rendering. The problem was that UXA was allocating a pixmap only to then use software-based rasterization to that pixmap (resulting in slow read-modify-write cycles). The obvious fix I implemented is to simply malloc a buffer, do the rasterization, and only then copy the result to a pixmap.
After I wrote the patch, it was very satisfying to be able to validate its real-world impact with a swfdec-based trace. This trace is based on using swfdec to view the Giant Steps movie. When running this trace, sysprof makes it obvious that trapezoid rendering is the primary bottleneck. Here is the output of cairo-perf-trace on a GM965 machine before my patch:
[ # ]  backend                         test   min(s) median(s) stddev. count
[  0]    image           swfdec-giant-steps   45.766   45.858  0.11%   6
[  0]     xlib           swfdec-giant-steps  194.422  194.602  0.05%   6
The performance problem is quite plain here. Replaying the swfdec trace to the X server takes 194 seconds compared to only 45 seconds to replay it only to cairo's all-software image backend. Note that 194 seconds is longer than the full video clip, meaning that my system isn't going to be able to keep up without skipping here. That's obviously not what we want.
Then, after my simple just-use-malloc patch I get:
[ # ]  backend                         test   min(s) median(s) stddev. count
[  0]    image           swfdec-giant-steps   45.792   46.014  0.37%   6
[  0]     xlib           swfdec-giant-steps   81.505   81.567  0.03%   6
Here the xlib result has improved from 194 seconds to 81 seconds. That's a 2.4x improvement, and fast enough to now play the movie without skipping. It's very satisfying to validate performance patches with real-world application code like this. This commit is in the recent 2.7.99.901 or the Intel driver, by the way. (Of course, there's still a 1.8x slowdown of the xlib backend compared to the image backend, so there's still more to be fixed here.)
The punchline is that we now have an easy way to benchmark 2D rendering in actual, real-world applications. If you see someone benchmarking with only toys like x11perf or gtkperf, go ahead and point them to this post, or the the cairo-perf-trace entry in the cairo FAQ, and insist on benchmarks from real applications.
Posted Fri 12 Jun 2009 05:36:41 PM PDTIt's hard for me to believe that my last technical post on the progress of the Intel graphics driver was nearly a year ago. Certainly, a lot has happened in that year, and recent developments have been covered well by Keith, Eric, and Jesse. So I won't go into any of those details, but I do want to give my impression of where things stand.
As my colleagues have described so well, a major restructuring of the driver is now complete, (KMS, GEM, dri2, removal of XAA, EXA, dri1, etc.). This restructuring caused months of upheaval, followed by months of stabilization during which many bugs were shaken out. The end result is that the primary developers are all optimistic about the current state of the driver. Things seem better than ever.
In the meantime, however, it's also obvious that some users are not happy with the driver, and some have gotten the impression that the quality is getting consistently worse with time. Some have theorized that no quality-assurance testing is happening, or that the developers just plain don't care about regressions. Neither of those theories are true, so why is there such a disconnect between the developers and the users?
One reason for unhappy users is the lag between development happening and users getting their hands on the code. So the phase of upheaval and instability might be behind the developers, but some users are just entering into it. This is exacerbated by the fact that the major restructuring puts several important components of the driver into the kernel. It used to be that getting the latest Intel driver just meant updating an xf86-video-intel module or upgrading an xserver-xorg-video-intel package. But now it's essential to get a recent kernel as well, (note that almost all of the major fixes that Eric describes happened in the kernel, not the user-level driver). And these fixes aren't in a major kernel release until 2.6.30 which appeared only today.
In addition, distributions and users have a tendency to update the kernel less frequently than user-level components. So when a user checks out the latest xf86-video-intel from git, (without a kernel upgrade), not only is that user not getting the "latest driver" as recommended by the developers, but they might also be running a combination that the developers and QA never saw nor tested.
For example, I recently attempted to run the latest-from-git Intel driver with a kernel version as installed by current Debian installation CDs. This kernel is ancient with respect to our driver development (2.6.25 I think). What I found was that the X server would not start at all. Obviously, we had neglected to test this particular combination, (so yes, QA isn't perfect---but it also can't cover the infinite number of possible combinations). Fortunately, the fix was simple, and appears in the 2.7.99.901 snapshot I just released (today!) so will appear in the 2.8.0 release very soon.
The packagers of X for Ubuntu have been working hard to address this exact problem of the lag between developers and users. They've setup a repository of packages named xorg-edgers where users can easily get packages built directly from git. I don't think it includes the kernel yet, as it will soon hopefully, but this is definitely a step in the right direction. Update: It does include a 2.6.30 kernel now---maybe all that time I spent writing this blog post wasn't wasted after all.
But what about the users that did upgrade their kernel and driver and are still seeing some major problems? In this case, we really want to hear from you. We take pride in our work and are committed to doing our best to make quality releases without regressions. When you hit some awful behavior, (GPU hang, scrambled mode, abysmal performance), it may be that you're just hitting a combination of components or application behavior that we've never seen before. We want those details and we want to fix the problem. File good bug reports and please make use of the "regression" keyword as appropriate. We pay attention to that.
Performance regressions are an especially important issue. In fact, performance is so important that I'll make a separate post about that. I've got some exciting news to share about performance measurement.
Posted Wed 10 Jun 2009 04:29:07 PM PDTMany readers have heard already, but it will be news to some that I recently changed jobs. After just short of 4 years with Red Hat, I've now taken a job working for Intel, (in its Open-source Technology Center). It was hard to leave Red Hat---I have only fond memories of working there, and I will always be grateful to Red Hat for first helping me launch a career out of working on Free Software.
Fortunately, as far as my free-software work is concerned, much of it will be unaffected by the job change. In fact, since I've been looking at X/2D/Intel driver graphics performance for the last year already, this job change should only help me do much more of that. And as far as cairo goes, I'll continue to maintain it, but I haven't been doing much feature development there lately anyway. Instead, the most important thing I feel I could do for cairo now is to continue to improve X 2D performance. And that's an explicit job requirement in my new position. So I think the job change will be neutral to positive for anyone interested in my free-software efforts.
As my first task at Intel, I took the nice HP 2510p laptop I was given on the first day, (which has i965 graphics of course), installed Linux on it, then compiled everything I needed for doing X development. I would have saved myself some pain if I had used these build instructions. I've since repeated that exercise with the instructions, and they work quite well, (though one can save some work by using distribution-provided development packages for many of the dependencies).
Also, since I want to do development with GEM, I built the drm-gem branches of the mesa, drm, and xf86-video-intel modules. That's as simple as doing "git checkout -b drm-gem origin/drm-gem" after the "git clone" of those three modules, (building the master branch of the xserver module is just fine). That seemed to build and run, so I quickly installed it as the X server I'm running regularly. I figured this would be great motivation for myself to fix any bugs I encountered---since they'd impact everything I tried to do.
Well, it didn't take long to find some performance bugs. Just switching workspaces was a rather slow experience---I could literally watch xchat repaint its window with a slow swipe. (Oddly enough, gnome-terminal and iceweasel could redraw similarly-sized windows much more quickly.) And it didn't take much investigation to find the problem since it was something I had found before, a big, blocking call to i830WaitSync in every composite operation. My old favorite, "x11perf -aa10text" was showing only 13,000 glyphs per second.
I had done some work to alleviate that before, and Dave Airlie had continued that until the call was entirely eliminated at one point. That happened on the old "intel-batchbuffer" branch of the driver. Recall that in January Eric and I had been disappointed to report that even after a recent 2x improvement, the intel-batchbuffer branch was only at 109,000 glyphs per second compared to 186,000 for XAA.
Well, that branch had about a dozen, large, unrelated changes in it, and poor Eric Anholt had been stuck with the job of cleaning them up and landing them independently to the master branch, (while also writing a new memory manager and porting the driver to it).
So here was one piece that just hadn't been finished yet. The driver was still just using a single vertex buffer that it allocates upfront---and a tiny buffer---just big enough for a single rectangle for a single composite operation. And so the driver was waiting for each composite operation to finish before reusing the buffer. And the change to GEM had made this problem even more noticeable. And Eric even had a partially-working patch to fix this---simply allocating a much larger vertex buffer and only doing the sync when wrapping around after filling it up. He had just been too busy with other things to get back to this patch. So this was one of those times when it's great to have a fresh new co-worker appear in the next cubicle asking how he could help. I took tested Eric's patch, broke it up into tiny pieces to test them independently, and Eric quickly found what was needed to fix it, (an explicit flush to avoid the hardware caching vertex-buffer entries that would be filled in on future composite calls).
So, with that in place the only thing left to decide was how large of a vertex buffer to allocate upfront. And that gives me an excuse to put in a performance plot:
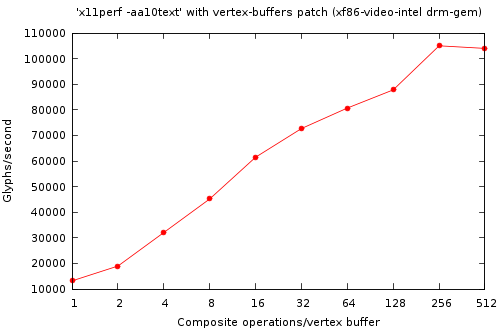
So the more the better, (obviously), until we get to 256 composite operations fitting into a single buffer. Then we start losing performance. So on the drm-gem branch, this takes performance from 13,000 glyphs/second to 100,000 glyphs/second for a 7.7x speedup. That's a nice improvement for a simple patch, even if the overall performance isn't astounding yet. It is at least fast enough that I can now switch workspaces without getting bored.
So I went ahead and applied these patches to the master branch as well. Interestingly, without any of the drm-gem branches, and even with the i830WaitSync call on every composite operation, things were already much better than in the GEM world. I measured 142,000 glyphs/second before my patch, and 208,000 glyphs/second after the patch. So only a 1.5x speedup there, but for the first time ever I'm actually measuring EXA text rendering that's faster than XAA text rendering. Hurrah!
And really, this is still just getting started. The patch I've described here is still just a bandaid. The real fix is to eliminate the upfront allocation and reuse of buffers. Instead, now that we have a real memory manager, (that's the whole point of GEM), we can allocated buffer objects as needed for vertex buffer, (and for surface state objects, etc.). That's the work I'll do next and it should let us finally see some of the benefits of GEM. Or if not, it will point out some of the remaining issues in GEM and we'll fix those right up. Either way, performance should just keep getting better and better.
Stay tuned for more from me, and look forward to faster performance from every Intel graphics driver release.
Posted Tue 15 Jul 2008 03:21:51 PM PDTI'm definitely overdue as far as posting an update on the progress of the work we've been doing to improve EXA performance for the i965 driver. And just yesterday, Benjamin Otte pointed out to me that it's really hard for many people to get any understanding at all about some of the work that's going on within the X.org development community.
Part of my reply to Benjamin was that there were a lot of excellent talks given at LCA this year, (Keith Packard, Dave Airlie, Adam Jackson, Jesse Barnes, Peter Hutterer, Eric Anholt, and myself were all there talking about X in one way or another). And that is true, but it's also true that many people were not able to attend LCA to hear those talks. And while the LCA conference kindly posts video of the talks that's not always the most desirable way of getting information when not at the conference in person.
So I think it would be fair to say that we've been doing a poor job of providing easy-to-find information about what's going on with X. I definitely want to help improve that, and I even just got an official designation to do exactly that. I was recently elected to the X.org Board of Directors and also assigned to chair a Communications committee whose job it is to help X.org communicate more effectively. What can we do better? Please email me with your ideas.
In the meantime, for my own part, I've just done a fairly thorough writeup of my LCA talk. That's something I've been wanting to get in the habit of doing for a while. One thing I can't stand is reading presentation slides that are almost content free---where clearly they weren't meant to stand alone but were meant to be accompanied by someone speaking for up to an hour. And I know I've been guilty of posting slides like that before. So this time, I've written some text that should stand alone quite well, (though, since I just wrote it today it might not correlate extremely well with what I said that day at LCA---but I've tried to address the same themes at least).
Posted Wed 12 Mar 2008 09:33:26 AM PDTAs readers of my blog know, I've been working on improving the Intel 965 driver within the EXA acceleration architecture of the X server. Meanwhile, there's an alternate acceleration architecture originally announced by Zack Rusin in August 2006 called Glucose. The idea with Glucose is to accelerate X rendering operations by using OpenGL.
Recently there's been a fair amount of activity in the various Glucose branches, so I thought I'd take a look to see how well it's working. This was quite convenient for me as the current Glucose work is focused only on Intel cards. Since Glucose isn't quite ready for prime-time yet, it does require fetching various non-master branches of several git repositories. It's not always obvious which branches to take, so José Fonseca was kind enough to writeup some Glucose build instructions.
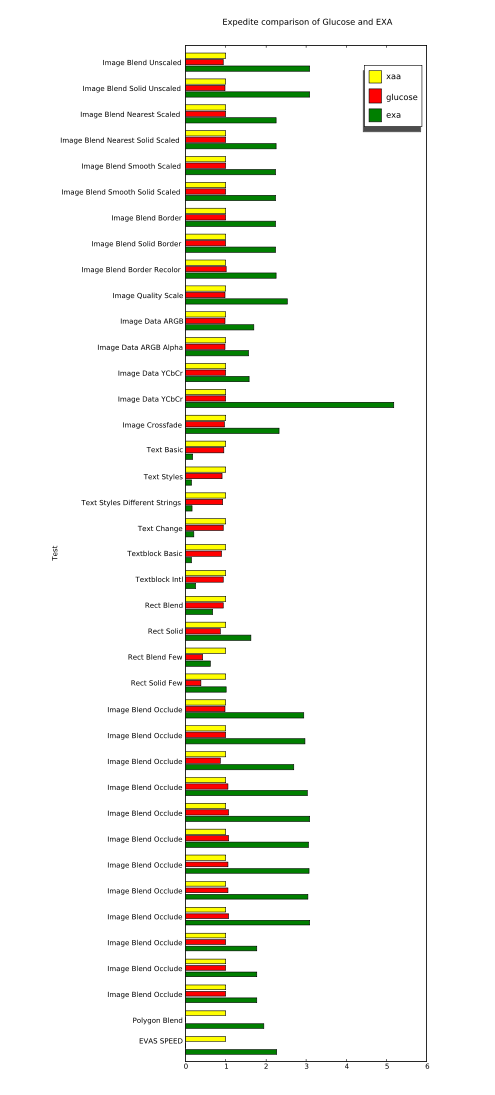
I've followed those instructions and run a benchmark comparing Glucose and EXA. The benchmark I chose is the expedite application that comes with evas, (thanks to the people that kindly pointed out this newer benchmark to me after my recent explorations with the older evas benchmarks). To get expedite you'll need the e17/libs/evas and e17/apps/expedite modules from enlightenment CVS.
Expedite is a nice benchmark in that it separates things like image blending and text rendering into separate tests, (unlike the older evas benchmark). It's also nice that evas includes many backends which can be interesting for comparison. But I won't be looking at anything but its XRender-based backends here---and it looks like evas' cairo and OpenGL backends are not currently functional. They are disabled by default, and when I enabled them I ran into compilation problems, (I suspect neglect and bit rot).
So here are the results I got for three acceleration architectures:
XAA with the XAANoOffscreenPixmaps option, (this is an all-software implementation for reference).
Glucose---the new thing we're looking at here.
EXA, (as available in the various glucose branches---so without things like my recent glyph-pixmaps work).
The results are all normalized to the performance of our baseline, XAA. And larger numbers are better.
The raw data is also available for anyone with particular interest, (it has non-normalized values as well as results from evas' software backends using both SDL and X11 for image transport).
The quick conclusion is that, so far, I'm not getting any benefit from running Glucose as compared to just running an all-software implementation, (see how all Glucose and XAA bars are basically identical). I might still not have everything compiled or running correctly yet, but I'm quite sure that at least some Glucose code was active during my Glucose run. That's because a glucose module failed to find a required symbol and crashed during the "Polygon Blend" test, (which is why it doesn't have a bar in the chart, nor is there a number for the overall "EVAS SPEED" result for Glucose).
Meanwhile, it's also clear that EXA is going far too slow for text operations. This isn't any surprise since I've documented problems with slow text rendering on the i965 several times before. However, I've never before measured text rendering that's quite this slow. I'm seeing speeds of only about 30k glyphs/sec. with EXA on these branches, while my previous testing always showed about 100k glyphs/sec. I suspect that there's been some regression somewhere in the X server or the Intel driver, (and likely unrelated to anything about Glucose---Keith has reported similar slowness with builds from the master branches).
Another interesting thing to look at is the difference caused by the "few" variants of the "Rect Blend" and "Rect Solid" tests. When going from the non-few to the "few" variants, both Glucose and EXA slow down significantly. I'm quite happy to see these tests in this benchmark since it is often the setup overhead that kills you when trying to accelerate a small number of operations, (and applications have a tendency to want to do that very often). Many synthetic benchmarks are extremely non-useful in hiding this overhead by doing huge batches of operations.
Meanwhile, I'm still working on fixing the horribly slow compositing problems in the i965 driver that are keeping text so slow. Keith Packard and Eric Anholt are helping me debug my code, and hopefully we'll soon have something to show which runs at a reasonable speed.
Posted Fri 19 Oct 2007 02:47:53 PM PDTEarlier this month I attended the X Developers' Summit in Cambridge, UK (not the Cambridge near Boston, USA). We stayed at Clare College which, like all of the University of Cambridge colleges that I saw, is immaculately well-kept and quite beautiful. Just look at the gardens I walked past every day to get from my room to the conference room in the library. Kudos to the X.Org foundation for arranging such a beautiful site, (I think Daniel Stone and Matthew Garrett deserve particular thanks), and for providing travel expenses so I could attend.
Adam "ajax" Jackson was kind enough to write up some notes on my talk and the other talks as well. I haven't posted slides from the talk, but it really wasn't much more than a condensed version of exa-related blog entries I've made, (and which are linked to in Adam's writeup).
One of the things I asked for in the talk is more benchmarks for 2D rendering---in particular real-world applications with benchmarking modes and micro-benchmarks distilled from real-world applications. Vincent Torri recently reminded me that Carsten "rasterman" Haitzler wrote render_bench a long time ago precisely to measure the performance of XRender, (and to compare it to his imlib2 software).
I hadn't run render_bench since I started playing with EXA and the
i965 chip, so it was definitely a worthwhile thing to do. Here are the
results I got (comparing XAA and EXA both against imlib2):
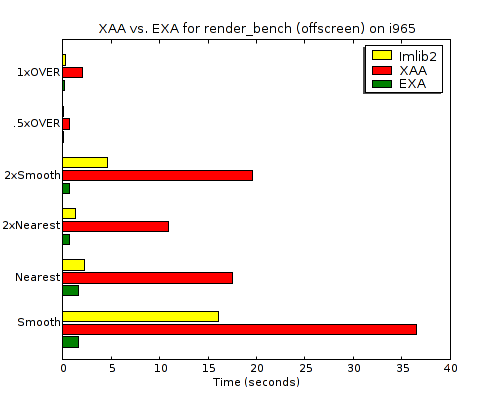
All of the numbers are from the same 2.13GHz dual-core Intel machine. But the absolute numbers aren't interesting anyway. The interesting part is the huge improvement in X Render performance going from XAA to EXA for the i965 device. It goes from 2-8 times slower than imlib2 to 1.3-12.9 times faster. Anyone interested in the raw times can view the EXA log and XAA log files.
One thing that would be useful is for someone to augment the framework to also test the same drawing operations through cairo. It would be good to verify that none of the cairo software layers get in the way of this performance, (I can imagine cairo doing something like setting up and tearing down XRender Picture objects rather than reusing them, but hopefully it will perform just as well).
And I should point out that this improvement is not due to anything I've done. This is basically just an upstream xserver tree, (it might have my glyph-pixmaps change but they are not relevant here). So kudos to the EXA hackers I mentioned in my talk, (Keith Packard, Zack Rusin, Eric Anholt, and Michel Dänzer). I definitely need to amend my what EXA gets right post to add image-scaling to window-copying and solid-fills.
This also isn't with any special hacks to the xf86-driver-intel source, (I'm using upstream commit 286f5df0b from Sep. 6). This benchmark clearly isn't hitting the same compositing slowness I'm seeing with glyph rendering and that might be because it's using larger images than the generally tiny images that are used for glyphs, (but I'm just guessing---I haven't looked closely).
Meanwhile, I am rewriting the driver to eliminate all the syncs and flushes when compositing to fix the glyph performance. I hope to have something worth sharing soon.
Finally, I also compared the results of evas_xrender_x11_test with
evas_software_x11_test. This is similar to the original render_bench,
but with a more real-world framework in place, (the evas canvas), as
opposed to just a micro benchmark. Here XRender/EXA did not fare as
well, scoring an evas benchmark score of 4.994 compared to the 10.418
of the software version. (Meanwhile XAA scored 4.840 but with some
noticeably incorrect results---the large scaled image came out just
black). The weaker performance here might very well be because the
evas tests do include text which render_bench does not, (but again I'm
just guessing and haven't looked closely).
Oh, and the evas snapshot I used for this test is
evas-0.9.9.023. I
tried to also test a newer snapshot such as
evas-0.9.9.041,
but it seems to not build the evas_*_test programs anymore. Perhaps
they're now available separately?
Sometimes things get worse before they get better.
A few days ago, I presented a patch for storing glyphs as pixmaps which improved performance, but not as dramatically as one would have hoped.
I profiled the result and found that there were still a lot of software fallbacks going on. Tracking things down, (hints: enable DEBUG_TRACE_FALL in xserver/exa/exa_priv.h and I830DEBUG in xf86-video-intel/src/i830.h), I found a simple case statement that was falling back to software for any compositing operation targeting an A8 buffer. Fortunately, it looks like this fallback was due to a limitation in older graphics card that doesn't exist on the i965. So a very simple patch eliminates the software fallback.
So lets take a look at before-and-after profiles:
Yikes! The patch takes us from 144k chars/sec. to only 95k chars/sec. I'm regressing performance! But look again, and see that the libexa time has been cut dramatically, and the libpixman time has been eliminated altogether. That's exactly what we would hope to see for eliminating software fallbacks. So I've finally gotten this text-rendering benchmark to involve no software fallbacks. Hurrah!
Meanwhile, the intel_drv and vmlinux time have increased dramatically. Take a look at how hot those hotspots are in their profiles:
intel_drv:
samples  %        symbol name
29614    41.2170  i965_prepare_composite
26641    37.0792  I830WaitLpRing
9143     12.7253  i965_composite
1618      2.2519  I830Sync
vmlinux:
samples  %        symbol name
28775    25.3748  delay_tsc
21956    19.3616  system_call
7535      6.6446  getnstimeofday
5109      4.5053  schedule
So this is just the same, old synchronous compositing bug I identified earlier. Performance has gotten worse since I'm stressing out the driver and this bug more.
Dave Airlie has been doing some recent work that should let us fix that bug once and for all. Hopefully it won't be too long before I can actually post some positive progress here.
PS. I've also gotten one report that my patch for storing glyphs as Pixmaps speeds glyph rendering up initially, but after the X server has been running for about an hour or so, things get really slow. Shame on me for not doing any testing more extensive than starting the X server and then running a single client for a few minutes, (either firefox or x11perf). The report is that most of the time is disappearing into ExaOffscreenMarkUsed. Well the good news is that Dave's work eliminates that function entirely, (along with lots of migration code in EXA), so hopefully there's not any big problem to fix there. I'll have to test more thoroughly after synching up with Dave.
Posted Tue 07 Aug 2007 06:13:22 PM PDT