
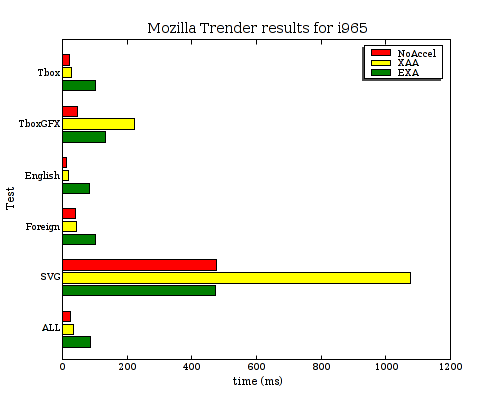
I recently posted results showing EXA (and XAA) performing quite badly on the Mozilla Trender benchmarks. As a reminder, here is the chart showing the results on an i965 card:
As a quick followup, here are the top functions when profiling the entire Trender suite in the NoAccel, XAA, and EXA cases.
CPU: Core 2, speed 2133.49 MHz (estimated)
Counted CPU_CLK_UNHALTED events (Clock cycles when not halted) with a unit mask of 0x00
(Unhalted core cycles) count 100000
samples  %        image name            app name              symbol name
1940211  41.7382  libxul.so             libxul.so             (no symbols)
955760   20.5605  libc-2.5.so           libc-2.5.so           (no symbols)
115195    2.4781  libfb.so              libfb.so              fbSolidFillmmx
108663    2.3376  libfb.so              libfb.so              fbCopyAreammx
78728     1.6936  libpixman.so.0.0.0    libpixman.so.0.0.0    pixman_rasterize_edges
76356     1.6426  libpixman.so.0.0.0    libpixman.so.0.0.0    pixmanCompositeRect
63186     1.3593  vmlinux               vmlinux               get_page_from_freelist
59977     1.2902  libpixman.so.0.0.0    libpixman.so.0.0.0    mmxCombineOverU
51859     1.1156  vmlinux               vmlinux               __d_lookup
49805     1.0714  libpixman.so.0.0.0    libpixman.so.0.0.0    pixman_image_composite
46590     1.0023  libpixman.so.0.0.0    libpixman.so.0.0.0    mmxCombineMaskU
As a baseline, this NoAccel profile looks pretty good. Mozilla itself is taking up 40% of the time in its libxul code. I'm not sure if the 20% in libc is on behalf of mozilla or X. Meanwhile, we can see X doing software rasterization and compositing with the pixman code, but no single function is chewing up any large proportion of the time.
XAA:
CPU: Core 2, speed 2133.49 MHz (estimated)
Counted CPU_CLK_UNHALTED events (Clock cycles when not halted) with a unit mask of 0x00
(Unhalted core cycles) count 100000
samples  %        image name            app name              symbol name
1895990  32.7139  libxul.so             libxul.so             (no symbols)
1065154  18.3785  libc-2.5.so           libc-2.5.so           (no symbols)
790802   13.6447  libpixman.so.0.0.0    libpixman.so.0.0.0    mmxCombineOverU
202183    3.4885  libpixman.so.0.0.0    libpixman.so.0.0.0    fbCompositeSolidMask_nx8888x8888Cmmx
112017    1.9328  libpixman.so.0.0.0    libpixman.so.0.0.0    fbCompositeSrc_8888x8888mmx
94824     1.6361  libpixman.so.0.0.0    libpixman.so.0.0.0    pixmanCompositeRect
84551     1.4589  libpixman.so.0.0.0    libpixman.so.0.0.0    fbCompositeSolidMask_nx8x8888mmx
76908     1.3270  libpixman.so.0.0.0    libpixman.so.0.0.0    pixman_rasterize_edges
57645     0.9946  vmlinux               vmlinux               system_call
52950     0.9136  libpixman.so.0.0.0    libpixman.so.0.0.0    mmxCombineMaskU
52265     0.9018  intel_drv.so          intel_drv.so          I830WaitLpRing
51640     0.8910  vmlinux               vmlinux               __d_lookup
48207     0.8318  libpixman.so.0.0.0    libpixman.so.0.0.0    pixman_image_composite_rect
Now, this XAA profile is certainly strange. Why has mmxCombineOverU jumped up from 1% to 13%. Why should there be any more compositing happening here. Is this pixel format conversion we're seeing for some reason?
EXA:
CPU: Core 2, speed 2133.49 MHz (estimated)
Counted CPU_CLK_UNHALTED events (Clock cycles when not halted) with a unit mask of 0x00
(Unhalted core cycles) count 100000
samples  %        image name            app name              symbol name
2465024  27.6332  intel_drv.so          intel_drv.so          i965_prepare_composite
1951957  21.8817  libxul.so             libxul.so             (no symbols)
1470150  16.4806  libc-2.5.so           libc-2.5.so           (no symbols)
382399    4.2867  libexa.so             libexa.so             ExaOffscreenMarkUsed
375330    4.2075  intel_drv.so          intel_drv.so          I830WaitLpRing
307074    3.4423  vmlinux               vmlinux               system_call
104493    1.1714  vmlinux               vmlinux               do_gettimeofday
97582     1.0939  intel_drv.so          intel_drv.so          i965_composite
79050     0.8862  libpixman.so.0.0.0    libpixman.so.0.0.0    pixman_rasterize_edges
53810     0.6032  vmlinux               vmlinux               __copy_to_user_ll
51434     0.5766  vmlinux               vmlinux               __d_lookup
And here with EXA we see some good, and some really bad. The good news
is that the pixman functions doing software compositing have
disappeared from the top of the profile, leaving only software
rasterization. But what's with this new i965_prepare_composite
function that's taking even more time than all of libxul? That seems
like rather excessive overhead.
A quick glimpse at the function, (starting at line 395 or so), shows that it's just a sequence of assignment statements, and then a "long sequence of commands needed to set up the 3D rendering pipe". Is any of that setup redundant and could it be easily eliminated?
I noticed two calls to i830WaitSync which seemed to have "slowdown" written all over them. But I ran with these two calls removed and didn't notice any change in the performance, (and if they were causing a problem, shouldn't they have shown up separately in the profile anyway?).